Naive Bayes Candlestick Pattern Classifier v1.1 BETAAn intermezzo on why i made this script publication..
A : Candlestick Pattern took hours to backtest, why not using Machine Learning techniques?
B : Machine Learning, no that's gonna be really heavy bro!
A : Not really, because we use Naive Bayes.
B : The simplest, yet powerful machine learning algorithm to separate (a.k.a classify) multivariate data.
----------------------------------------------------------------------------------------------------------------------
Hello, everyone!
After deep research in extracting meaningful information from the market, I ended up building this powerful machine learning indicator based on the evolution of Bayesian Statistics. This indicator not only leverages the simplicity of Naive Bayes but also extends its application to candlestick pattern analysis, making it an invaluable tool for traders who are looking to enhance their technical analysis without spending countless hours manually backtesting each pattern on each market!.
What most interesting part is actually after learning all of likely useless methods like fibonacci, supply and demand, volume profile, etc. We always ended up back to basic like support and resistance and candlestick patterns, but with a slight twist on strategy algorithm design and statistical approach. Thus, the only reason why i made this, because i exactly know that you guys will ended up in this position as time goes by.
The essence of this indicator lies in its ability to automate the recognition and statistical evaluation of various candlestick patterns. Traditionally, traders have relied on visual inspection and manual backtesting to determine the effectiveness of patterns like Bullish Engulfing, Bearish Engulfing, Harami variations, Hammer formations, and even more complex multi-candle patterns such as Three White Soldiers, Three Black Crows, Dark Cloud Cover, and Piercing Pattern. However, these conventional methods are both time-consuming and prone to subjective bias.
To address these challenges, I employed Naive Bayes—a probabilistic classifier that, despite its simplicity, offers robust performance in various domains. Naive Bayes assumes that each feature is independent of the others given the class label, which, although a strong assumption, works remarkably well in practice, especially when the dataset is large like market data and the feature space is high-dimensional. In our case, each candlestick pattern acts as a feature that can be statistically evaluated based on its historical performance. The indicator calculates a probability that a given pattern will lead to a price reversal, by comparing the pattern’s close price to the highest or lowest price achieved in a lookahead window.
One of the standout features of this script is its flexibility. Each candlestick pattern is not only coded into the system but also comes with individual toggles to enable or disable them based on your trading strategy. This means you can choose to focus on single-candle patterns like Bullish Engulfing or more complex multi-candle formations such as Three White Soldiers, without modifying the core code. The built-in customization options allow you to adjust colors and labels for each pattern, giving you the freedom to tailor the visual output to your preference. This level of customization ensures that the indicator integrates seamlessly into your existing TradingView setup.
Moreover, the indicator isn’t just about pattern recognition—it also incorporates outcome-based learning. Every time a pattern is detected, it looks ahead a predefined number of bars to evaluate if the expected reversal actually materialized. This outcome is then stored in arrays, and over time, the script dynamically calculates the probability of success for each pattern. These probabilities are presented in a real-time updating table on your chart, which shows not only the percentage probability but also the count of historical occurrences. With this information at your fingertips, you can quickly gauge the reliability of each pattern in your chosen market and timeframe.
Another significant advantage of this approach is its speed and efficiency. While more complex machine learning models like neural networks might require heavy computational resources and longer training times, the Naive Bayes classifier in this script is lightweight, instantaneous and can be updated on the fly with each new bar. This real-time capability is essential for modern traders who need to make quick decisions in fast-paced markets.
Furthermore, by automating the process of backtesting, the indicator frees up your time to focus on other aspects of trading strategy development. Instead of manually analyzing hundreds or even thousands of candles, you can rely on the statistical power of Naive Bayes to provide you with insights on which patterns are most likely to result in profitable moves. This not only enhances your efficiency but also helps to eliminate the cognitive biases that often plague manual analysis.
In summary, this indicator represents a fusion of traditional candlestick analysis with modern machine learning techniques. It harnesses the simplicity and effectiveness of Naive Bayes to deliver a dynamic, real-time evaluation of various candlestick patterns. Whether you are a seasoned trader looking to refine your technical analysis or a beginner eager to understand market dynamics, this tool offers a powerful, customizable, and efficient solution. Welcome to a new era where advanced statistical methods meet practical trading insights—happy trading and may your patterns always be in your favor!
Note : On this current released beta version, you must manually adjust reversal percentage move based on each market. Further updates may include automated best range detection and probability.
Cerca negli script per "Pattern recognition"

The Pattern-Synced Moving Average System (PSMA)Description:
The Pattern-Synced Moving Average System (PSMA) is a comprehensive trading indicator that combines the reliability of moving averages with automated candlestick pattern detection, real-time alerts, and dynamic risk management to enhance both trend-following and reversal strategies. The PSMA system integrates key elements of trend analysis and pattern recognition to provide users with configurable entry, stop-loss, and take-profit levels. It is designed for all levels of traders who seek to trade in alignment with market context, using signals from trend direction and established candlestick patterns.
Key Functional Components:
Multi-Type Moving Average:
Provides flexibility with multiple moving average options: SMA, EMA, WMA, and SMMA.
The selected moving average helps users determine market trend direction, with price positions relative to the MA acting as a trend confirmation.
Automatic Candlestick Pattern Detection:
Identifies pivotal patterns, including bullish/bearish engulfing and reversal signals.
Helps traders spot potential market turning points and adjust their strategies accordingly.
Configurable Entry, Stop-Loss, and Take-Profit:
Risk management is customizable through risk/reward ratios and risk tolerance settings.
Entry, stop-loss, and take-profit levels are automatically plotted when patterns appear, facilitating rapid trade decision-making with predefined exit points.
Higher Timeframe Trend Confirmation:
Optional feature to verify trend alignment on a higher timeframe (e.g., checking a daily trend on an intraday chart).
This added filter improves signal reliability by focusing on patterns aligned with the broader market trend.
Real-Time Alerts:
Alerts can be set for key pattern detections, allowing traders to respond promptly without constant chart monitoring.
How to Use PSMA:
Set Moving Average Preferences:
Choose the preferred moving average type and length based on your trading strategy. The MA acts as a foundational trend indicator, with price positions indicating potential uptrends (price above MA) or downtrends (price below MA).
Adjust Risk Management Settings:
Set a Risk/Reward Ratio for defining take-profit levels relative to the entry and stop-loss levels.
Modify the Risk Tolerance Percentage to adjust stop-loss placement, adding flexibility in managing trades based on market volatility.
Activate Higher Timeframe Confirmation (Optional):
Enable higher timeframe trend confirmation to filter out counter-trend trades, ensuring that detected patterns are in sync with the larger market trend.
Review Alerts and Trade Levels:
With PSMA’s real-time alerts, traders receive notifications for detected patterns without having to continuously monitor charts.
Visualized entry, stop-loss, and take-profit lines simplify trade execution by highlighting levels directly on the chart.
Execute Based on Entry and Exit Levels:
The entry line suggests the potential entry price once a bullish or bearish pattern is detected.
The stop-loss line is based on your set risk tolerance, establishing a predefined risk level.
The take-profit line is calculated according to your preferred risk/reward ratio, providing a clear profit target.
Example Strategy:
Ensure price is above or below the selected moving average to confirm trend direction.
Await a PSMA signal for a bullish or bearish pattern.
Review the plotted entry, stop-loss, and take-profit lines, and enter the trade if the setup aligns with your risk/reward criteria.
Activate alerts for continuous monitoring, allowing PSMA to notify you of emerging trade opportunities.
Release Notes:
Line Color and Style Customization: Customizable colors and line styles for entry, stop-loss, and take-profit levels.
Dynamic Trade Tracking: Tracks trade statistics, including total trades, win rate, and average P/L, displayed in the data window for comprehensive trade performance analysis.
Summary: The PSMA indicator is a powerful, user-friendly tool that combines trend detection, pattern recognition, and risk management into a cohesive system for improved trade decision-making. Suitable for stocks, forex, and futures, PSMA offers a unique blend of adaptability and precision, making it valuable for day traders and long-term investors alike. Enjoy this tool as it enhances your ability to execute timely, well-informed trades on TradingView.
Mars Signals - SSL Trend AnalyzerIntroduction
The "Mars Signals - Precision Trend Analyzer with SSL Baseline & Price Action Zones" is a comprehensive technical analysis tool designed for traders seeking to enhance their market analysis and trading strategies. This indicator integrates multiple advanced trading concepts, including dynamic moving averages, trend detection algorithms, momentum indicators, volume analysis, higher timeframe confirmation, candlestick pattern recognition, and precise price action zones. By combining these elements, the indicator aims to provide clear and actionable buy and sell signals, helping traders to make informed decisions in various market conditions.
Core Components and Functionality
1.Dynamic Baseline Calculation
Moving Average Types: The indicator allows users to select from a variety of moving average types for the baseline calculation, including Simple Moving Average (SMA), Exponential Moving Average (EMA), Hull Moving Average (HMA), Weighted Moving Average (WMA), Double EMA (DEMA), Triple EMA (TEMA), Least Squares Moving Average (LSMA), Triangular Moving Average (TMA), Kijun (from Ichimoku Kinko Hyo), and McGinley's Dynamic.
Baseline Length: Users can customize the length of the moving average, providing flexibility to adjust the sensitivity of the baseline to market movements.
Signal Line Generation: The indicator computes a dynamic signal line based on the relationship between the close price and the moving averages of the high and low prices. This signal line adapts to market volatility and trend changes.
2.SSL Baseline Integration
SSL Baseline: In addition to the primary baseline, the indicator incorporates an SSL (Semaphore Signal Level) Baseline, which further refines trend detection by considering the highs and lows over a specified period.
Dual Confirmation: The combination of the primary baseline and the SSL baseline enhances the reliability of the trend signals by requiring agreement between both baselines before generating a signal.
3.Momentum and Trend Filters
Relative Strength Index (RSI): The indicator uses the RSI to assess the momentum of price movements, filtering out signals that occur during overbought or oversold conditions.
Moving Average Convergence Divergence (MACD): The MACD is employed to identify the direction and strength of the trend, adding another layer of confirmation to the signals.
Average Directional Index (ADX): The ADX measures the strength of the trend, ensuring that signals are generated only when the market shows significant directional movement.
4.Volume Analysis
Volume Filter: An optional volume filter compares the current volume to its moving average, allowing traders to focus on signals that occur during periods of higher market activity.
5.Higher Timeframe Confirmation
Multi-Timeframe Analysis: The indicator can incorporate data from a higher timeframe, comparing the current price to the higher timeframe's baseline and signal line. This feature helps traders align their trades with the broader market trend.
6.Candlestick Pattern Recognition
Bullish Patterns: The indicator detects bullish patterns such as Bullish Engulfing, Piercing Line, Hammer, and Doji.
Bearish Patterns: It also identifies bearish patterns like Bearish Engulfing, Dark Cloud Cover, Shooting Star, and Doji.
Pattern Prioritization: The patterns are prioritized to highlight the most significant formations, which can serve as additional confirmation for trade entries and exits.
7.Price Action Zones
Support and Resistance Levels: The indicator automatically identifies pivot highs and lows to establish dynamic support and resistance levels.
Zone Visualization: It draws shaded rectangles on the chart to represent these zones, providing a clear visual aid for potential reversal or breakout areas.
ATR-Based Zone Width: The zones' thickness is dynamically calculated using the Average True Range (ATR), adjusting to the current market volatility.
Background Coloring: The chart background changes color when the price is above the maximum resistance or below the minimum support, alerting traders to significant price movements.
Interpreting the Signals
1.Buy Signals
Conditions:
Price crosses above the signal line.
RSI is below 70 (not overbought).
MACD line is above the signal line (indicating bullish momentum).
ADX is above the user-defined threshold (default is 20), confirming a strong trend.
(Optional) Volume is above its moving average if the volume filter is enabled.
(Optional) Price is above the higher timeframe baseline and signal line if the higher timeframe filter is enabled.
(Optional) A bullish candlestick pattern is detected if the candlestick pattern filter is enabled.
Visual Indicators:
An upward-pointing label with the text "BUY" appears below the price bar.
The baseline and SSL baseline lines turn to colors indicating bullish conditions.
2.Sell Signals
Conditions:
Price crosses below the signal line.
RSI is above 30 (not oversold).
MACD line is below the signal line (indicating bearish momentum).
ADX is above the user-defined threshold, confirming a strong trend.
(Optional) Volume is above its moving average if the volume filter is enabled.
(Optional) Price is below the higher timeframe baseline and signal line if the higher timeframe filter is enabled.
(Optional) A bearish candlestick pattern is detected if the candlestick pattern filter is enabled.
Visual Indicators:
A downward-pointing label with the text "SELL" appears above the price bar.
The baseline and SSL baseline lines turn to colors indicating bearish conditions.
3.Support and Resistance Zones
Interpretation:
Resistance Zones: Represent areas where the price may face selling pressure. A break above these zones can signal a strong bullish move.
Support Zones: Represent areas where the price may find buying interest. A break below these zones can signal a strong bearish move.
Background Color:
The background turns red when the price is above the maximum resistance, indicating potential overextension.
The background turns green when the price is below the minimum support, indicating potential undervaluation.
Effective Usage Strategies
1.Customization
Adjusting Baseline and SSL Settings: Traders should experiment with different moving average types and lengths to match their trading style and the specific characteristics of the asset being analyzed.
Filtering Parameters: Modify RSI, MACD, and ADX settings to fine-tune the sensitivity of the signals.
Volume and Higher Timeframe Filters: Enable these filters to add robustness to the signals, especially in volatile markets or when trading higher timeframes.
2.Combining with Other Analysis
Fundamental Analysis: Use the indicator in conjunction with fundamental insights to validate technical signals.
Risk Management: Always apply proper risk management techniques, such as setting stop-loss and take-profit levels based on the support and resistance zones provided by the indicator.
3.Backtesting
Historical Analysis: Utilize the indicator's settings to backtest trading strategies on historical data, helping to identify the most effective configurations before applying them in live trading.
4.Monitoring Market Conditions
Volatility Awareness: Pay attention to the ATR and ADX readings to understand market volatility and trend strength, adjusting strategies accordingly.
Event Considerations: Be cautious around major economic announcements or events that may impact market behavior beyond technical indications.
Indicator Inputs and Customization Options
Baseline Type and Length: Select from multiple moving average types and specify the period length.
ADX Settings: Adjust the length, smoothing, and threshold for trend strength confirmation.
Volume Filter: Enable or disable the volume confirmation filter.
Higher Timeframe Filter: Choose to incorporate higher timeframe analysis and specify the desired timeframe.
Candlestick Patterns: Enable or disable the detection of candlestick patterns for additional signal confirmation.
SSL Baseline Type and Length: Customize the SSL baseline settings separately from the primary baseline.
Price Action Zones Settings:
Zone Thickness: Adjust the visual thickness of the support and resistance zones.
Lookback Period: Define how far back the indicator looks for pivot points.
ATR Multiplier for Zone Width: Set the multiplier for ATR to determine the dynamic width of the zones.
Maximum Number of Zones: Limit the number of support and resistance zones displayed.
Pivot Bars: Customize the number of bars to the left and right used for identifying pivot highs and lows.
Conclusion
The "Mars Signals - Precision Trend Analyzer with SSL Baseline & Price Action Zones" is a versatile and powerful tool that amalgamates essential technical analysis techniques into a single, user-friendly indicator. By providing clear visual signals and incorporating multiple layers of confirmation, it assists traders in identifying high-probability trading opportunities. Whether you are a day trader, swing trader, or long-term investor, this indicator can be tailored to suit your trading style and enhance your decision-making process.
To maximize the benefits of this indicator:
Understand Each Component: Familiarize yourself with how each part of the indicator contributes to the overall signal generation.
Customize Thoughtfully: Adjust the settings based on the asset class, market conditions, and your risk tolerance.
Practice Diligently: Use demo accounts or paper trading to practice and refine your strategy before deploying it in live markets.
Stay Informed: Continuously educate yourself on technical analysis and market dynamics to make the most informed decisions.
Disclaimer
Trading financial markets involves risk, and past performance is not indicative of future results. This indicator is a tool to aid in analysis and should not be the sole basis for any trading decision. Always conduct your own research and consider consulting with a licensed financial advisor.

Multi-Timeframe Recursive Zigzag [Trendoscope®]🎲 Welcome to the Advanced World of Zigzag Analysis
Embark on a journey through the most comprehensive and feature-rich Zigzag implementation you’ll ever encounter. Our Multi-Timeframe Recursive Zigzag Indicator is not just another tool; it's a groundbreaking advancement in technical analysis.
🎯 Key Features
Multi Time-Frame Support - One of the rare open-source Zigzag indicators with robust multi-timeframe capabilities, this feature sets our tool apart, enabling a broader and more dynamic market analysis.
Innovative Recursive Zigzag Algorithm - At its core is our unique Recursive Zigzag Algorithm, a pioneering development that powers multiple Zigzag levels, offering an intricate view of market movements. This proprietary algorithm is the backbone of our advanced pattern recognition indicators.
Sub-Waves and Micro-Waves Analysis - Dive deeper into market trends with our Sub-Waves and Micro-Waves feature. Sub-Waves reveal the interconnectedness of various Zigzag levels, while Micro-Waves offer insight into the fundamental waves at the base level.
Enhanced Indicator Tracking - Integrate and track your custom indicators or oscillators with the zigzag, capturing their values at each Zigzag level, complete with retracement ratios. This offers a comprehensive view of market dynamics.
Curved Zigzag Visualization - Experience a new way of visualizing market movements with our Curved Zigzag Display, employing Pine Script’s polyline feature for a more intuitive and visually appealing representation.
Built-in Customizable Alerts - Stay ahead with built-in alerts that can be customized via user input settings.
🎯 Practical Applications
Our Zigzag Indicator is designed with an understanding of its inherent nature - the last unconfirmed pivot that consistently repaints. This characteristic, while by design, directs its usage more towards pattern recognition rather than direct identification of market tops and bottoms. Here's how you can leverage the Zigzag Indicator:
Harmonic Patterns - Ideal for those familiar with harmonic patterns, this tool simplifies the manual spotting of complex XABCD, ABC, and ABCD patterns on charts.
Chart Patterns - Effortlessly identify patterns like Double/Triple Taps, Head and Shoulders, Inverse Head and Shoulders, and Cup and Handle patterns with enhanced clarity. Navigate through challenging patterns such as Triangles, Wedges, Flags, and Price Channels, where the Zigzag Indicator adds a layer of precision to your breakout strategy.
Elliott Wave Components - The indicator's detailed pivot highlighting aids in identifying key Elliott Wave components, enhancing your wave analysis and decision-making process.
🎲 Deep Dive into Indicator Features
Join us as we explore the intricate features of our indicator in more detail.
🎯 Multi-Timeframe Capability
Our indicator comes equipped with an input option for selecting the desired resolution. This unique feature allows users to view higher timeframe Zigzag patterns directly on their lower timeframe charts.
🎯 Recursive Multi Level Zigzag
Our advanced recursive approach creates multi-level Zigzags from lower-level data. For instance, the level 0 Zigzag forms the base, calculated from specified length and depth parameters, while level 1 Zigzag is derived using level 0 as its foundation, and so forth.
The indicator not only displays multiple Zigzag levels but also offers settings to emphasize specific levels for more detailed analysis.
🎯 Sub-Components and Micro-Components of Zigzag Wave
Sub-components within a Zigzag wave consist of the previous level's Zigzag pivots. Meanwhile, the micro-components are composed of the base level (Level 0) Zigzag pivots encapsulated within the wave.
🎯 Curved Zigzag
Experience a new perspective with our curved Zigzag display. This innovative feature utilizes the polyline curved option to automatically generate sinusoidal waves based on multiple points.
🎯 Indicator Tracking
Default indicators such as RSI, MFI, and OBV are included, alongside the ability to track one external indicator at each Zigzag pivot.
🎯 Customizable Alerts
Our indicator employs the `alert()` function for alert creation. While this means the absence of a customization text box in the alert settings, we've included a custom text area for users to create their own alert templates.
Template placeholders include:
{alertType} - type of alert. Either Confirmed Pivot Update or Last Pivot Update. Depends on the alert type selected in the inputs.
When Last Pivot Update type is selected, the alerts are triggered whenever there is a new Zigzag Pivot. This may also be a repaint of last unconfirmed pivot.
When Confirmed Pivot Update type is selected, the alerts are triggered only when a pivot becomes a confirmed pivot.
{level} - Zigzag level on which the alert is triggered.
{pivot} - Details of the last pivot or confirmed pivot including price, ratio, indicator values and ratios, subcomponent and micro-component pivots.
🎲 User Settings Overview
🎯 Zigzag and Generic Settings
This involves some generic zigzag calculation settings such as length, depth, and timeframe. And few display options such as theme, Highlight Level and Curved Zigzag. By default, zigzag calculation is done based on the latest real time bar. An option is provided to disable this and use only confirmed bars for the calculation.
Indicator Settings
Allows users to track one or more oscillators or volume indicators. Option to add any indicator via external input is provided.
🎯 Alert Settings
Has input fields required to select and customize alerts.

Sniffer
╭━━━╮╱╱╱╱╭━╮╭━╮
┃╭━╮┃╱╱╱╱┃╭╯┃╭╯
┃╰━━┳━╮╭┳╯╰┳╯╰┳━━┳━╮
╰━━╮┃╭╮╋╋╮╭┻╮╭┫┃━┫╭╯
┃╰━╯┃┃┃┃┃┃┃╱┃┃┃┃━┫┃
╰━━━┻╯╰┻╯╰╯╱╰╯╰━━┻╯
Overview
A vast majority of modern data analysis & modelling techniques rely upon the idea of hidden patterns, wether it is some type of visualisation tool or some form of a complex machine learning algorithm, the one thing that they have in common is the belief, that patterns tell us what’s hidden behind plain numbers. The same philosophy has been adopted by many traders & investors worldwide, there’s an entire school of thought that operates purely based on chart patterns. This is where Sniffer comes in, it is a tool designed to simplify & quantify the job of pattern recognition on any given price chart, by combining various factors & techniques that generate high-quality results.
This tool analyses bars selected by the user, and highlights bar clusters on the chart that exhibit similar behaviour across multiple dimensions. It can detect a single candle pattern like hammers or dojis, or it can handle multiple candles like morning/evening stars or double tops/bottoms, and many more. In fact, the tool is completely independent of such specific candle formations, instead, it works on the idea of vector similarity and generates a degree of similarity for every single combination of candles. Only the top-n matches are highlighted, users get to choose which patterns they want to analyse and to what degree, by customising the feature-space.
Background
In the world of trading, a common use-case is to scan a price chart for some specific candlestick formations & price structures, and then the chart is further analysed in reference to these events. Traders are often trying to answer questions like, when was the last time price showed similar behaviour, what are the instances similar to what price is doing right now, what happens when price forms a pattern like this, what were some of other indicators doing when this happened last(RSI, CCI, ADX etc), and many other abstract ideas to have a stronger confluence or to confirm a bias.Having such a context can be vital in making better informed decisions, but doing this manually on a chart that has thousands of candles can have many disadvantages. It’s tedious, human errors are rather likely, and even if it’s done with pin-point accuracy, chances are that we’ll miss out on many pieces of information. This is the thought that gave birth to Sniffer .
Sniffer tries to provide a general solution for pattern-based analysis by deploying vector-similarity computation techniques, that cover the full-breadth of a price chart and generate a list of top-n matches based on the criteria selected by the user. Most of these techniques come from the data science space, where vector similarity is often implemented to solve classification & clustering problems. Sniffer uses same principles of vector comparison, and computes a degree of similarity for every single candle formation within the selected range, and as a result generates a similarity matrix that captures how similar or dissimilar a set of candles is to the input set selected by the user.
How It Works
A brief overview of how the tool is implemented:
- Every bar is processed, and a set of features are mapped to it.
- Bars selected by the user are captured, and saved for later use.
- Once the all the bars have been processed, candles are back-tracked and degree of similarity is computed for every single bar(max-limit is 5000 bars).
- Degree of similarity is computed by comparing attributes like price range, candle breadth & volume etc.
- Similarity matrix is sorted and top-n results are highlighted on the chart through boxes of different colors.
A brief overview of the features space for bars:
- Range: Difference between high & low
- Body: Difference between close & open
- Volume: Traded volume for that candle
- Head: Upper wick for green candles & lower wick for red candles
- Tail: Lower wick for green candles & upper wick for red candles
- BTR: Body to Range ratio
- HTR: Head to Range ratio
- TTR: Tail to Range ratio
- HTB: Head to Body ratio
- TTB: Tail to Body ratio
- ROC: Rate of change for HL2 for four different periods
- RSI: Relative Strength Index
- CCI: Commodity Channel Index
- Stochastic: Stochastic Index
- ADX: DMI+, DMI- & ADX
A brief overview of how degree of similarity is calculated:
- Each bar set is compared to the inout bar set within the selected feature space
- Features are represented as vectors, and distance between the vectors is calculated
- Shorter the distance, greater the similarity
- Different distance calculation methods are available to choose from, such as Cosine, Euclidean, Lorentzian, Manhattan, & Pearson
- Each method is likely to generate slightly different results, users are expected to select the method & the feature space that best fits their use-case
How To Use It
- Usage of this tool is relatively straightforward, users can add this indicator to their chart and similar clusters will be highlighted automatically
- Users need to select a time range that will be treated as input, and bars within that range become the input formation for similarity calculations
- Boxes will be draw around the clusters that fit the matching criteria
- Boxes are color-coded, green color boxes represent the top one-third of the top-n matches, yellow boxes represent the middle third, red boxes are for bottom third, and white box represents user-input
- Boxes colors will be adjusted as you adjust input parameters, such as number of matches or look-back period
User Settings
Users can configure the following options:
- Select the time-range to set input bars
- Select the look-back period, number of candles to backtrack for similarity search
- Select the number of top-n matches to show on the chart
- Select the method for similarity calculation
- Adjust the feature space, this enables addition of custom features, such as pattern recognition, technical indicators, rate of change etc
- Toggle verbosity, shows degree of similarity as a percentage value inside the box
Top Features
- Pattern Agnostic: Designed to work with variable number of candles & complex patterns
- Customisable Feature Space: Users get to add custom features to each bar
- Comprehensive Comparison: Generates a degree of similarity for all possible combinations
Final Note
- Similarity matches will be shown only within last 4500 bars.
- In theory, it is possible to compute similarity for any size candle formations, indicator has been tested with formations of 50+ candles, but it is recommended to select smaller range for faster & cleaner results.
- As you move to smaller time frames, selected time range will provide a larger number of candles as input, which can produce undesired results, it is advised to adjust your selection when you change time frames. Seeking suggestions on how to directly receive bars as user input, instead of time range.
- At times, users may see array index out of bound error when setting up this indicator, this generally happens when the input range is not properly configured. So, it should disappear after you select the input range, still trying to figure out where it is coming from, suggestions are welcome.
Credits
- @HeWhoMustNotBeNamed for publishing such a handy PineScript Logger, it certainly made the job a lot easier.

Bjorgum Double Tap█ OVERVIEW
Double Tap is a pattern recognition script aimed at detecting Double Tops and Double Bottoms. Double Tap can be applied to the broker emulator to observe historical results, run as a trading bot for live trade alerts in real time with entry signals, take profit, and stop orders, or to simply detect patterns.
█ CONCEPTS
How Is A Pattern Defined?
Doubles are technical formations that are both reversal patterns and breakout patterns. These formations typically have a distinctive “M” or a “W” shape with price action breaking beyond the neckline formed by the center of the pattern. They can be recognized when a pivot fails to break when tested for a second time and the retracement that follows breaks beyond the key level opposite. This can trap entrants that were playing in the direction of the prior trend. Entries are made on the breakout with a target projected beyond the neckline equal to the height of the pattern.
Pattern Recognition
Patterns are recognized through the use of zig-zag; a method of filtering price action by connecting swing highs and lows in an alternating fashion to establish trend, support and resistance, or derive shapes from price action. The script looks for the highest or lowest point in a given number of bars and updates a list with the values as they form. If the levels are exceeded, the values are updated. If the direction changes and a new significant point is made, a new point is added to the list and the process starts again. Meanwhile, we scan the list of values looking for the distinctive shape to form as previously described.
█ STRATEGY RESULTS
Back Testing
Historical back testing is the most common method to test a strategy due in part to the general ease of gathering quick results. The underlying theory is that any strategy that worked well in the past is likely to work well in the future, and conversely, any strategy that performed poorly in the past is likely to perform poorly in the future. It is easy to poke holes in this theory, however, as for one to accept it as gospel, one would have to assume that future results will match what has come to pass. The randomness of markets may see to it otherwise, so it is important to scrutinize results. Some commonly used methods are to compare to other markets or benchmarks, perform statistical analysis on the results over many iterations and on differing datasets, walk-forward testing, out-of-sample analysis, or a variety of other techniques. There are many ways to interpret the results, so it is important to do research and gain knowledge in the field prior to taking meaningful conclusions from them.
👉 In short, it would be naive to place trust in one good backtest and expect positive results to continue. For this reason, results have been omitted from this publication.
Repainting
Repainting is simply the difference in behaviour of a strategy in real time vs the results calculated on the historical dataset. The strategy, by default, will wait for confirmed signals and is thus designed to not repaint. Waiting for bar close for entires aligns results in the real time data feed to those calculated on historical bars, which contain far less data. By doing this we align the behaviour of the strategy on the 2 data types, which brings significance to the calculated results. To override this behaviour and introduce repainting one can select "Recalculate on every tick" from the properties tab. It is important to note that by doing this alerts may not align with results seen in the strategy tester when the chart is reloaded, and thus to do so is to forgo backtesting and restricts a strategy to forward testing only.
👉 It is possible to use this script as an indicator as opposed to a full strategy by disabling "Use Strategy" in the "Inputs" tab. Basic alerts for detection will be sent when patterns are detected as opposed to complex order syntax. For alerts mid-bar enable "Recalculate on every tick" , and for confirmed signals ensure it is disabled.
█ EXIT ORDERS
Limit and Stop Orders
By default, the strategy will place a stop loss at the invalidation point of the pattern. This point is beyond the pattern high in the case of Double Tops, or beneath the pattern low in the case of Double Bottoms. The target or take profit point is an equal-legs measurement, or 100% of the pattern height in the direction of the pattern bias. Both the stop and the limit level can be adjusted from the user menu as a percentage of the pattern height.
Trailing Stops
Optional from the menu is the implementation of an ATR based trailing stop. The trailing stop is designed to begin when the target projection is reached. From there, the script looks back a user-defined number of bars for the highest or lowest point +/- the ATR value. For tighter stops the user can look back a lesser number of bars, or decrease the ATR multiple. When using either Alertatron or Trading Connector, each change in the trail value will trigger an alert to update the stop order on the exchange to reflect the new trail price. This reduces latency and slippage that can occur when relying on alerts only as real exchange orders fill faster and remain in place in the event of a disruption in communication between your strategy and the exchange, which ensures a higher level of safety.
👉 It is important to note that in the case the trailing stop is enabled, limit orders are excluded from the exit criteria. Rather, the point in time that the limit value is exceeded is the point that the trail begins. As such, this method will exit by stop loss only.
█ ALERTS
Five Built-in 3rd Party Destinations
The following are five options for delivering alerts from Double Tap to live trade execution via third party API solutions or chat bots to share your trades on social media. These destinations can be selected from the input menu and alert syntax will automatically configure in alerts appropriately to manage trades.
Custom JSON
JSON, or JavaScript Object Notation, is a readable format for structuring data. It is used primarily to transmit data between a server and a web application. In regards to this script, this may be a custom intermediary web application designed to catch alerts and interface with an exchange API. The JSON message is a trade map for an application to read equipped with where its been, where its going, targets, stops, quantity; a full diagnostic of the current state and its previous state. A web application could be configured to follow the messages sent in this format and conduct trades in sync with alerts running on the TV server.
Below is an example of a rendered JSON alert:
{
"passphrase": "1234",
"time": "2022-05-01T17:50:05Z",
"ticker": "ETHUSDTPERP",
"plot": {
"stop_price": 2600.15,
"limit_price": 3100.45
},
"strategy": {
"position_size": 0.1,
"order_action": "buy",
"market_position": "long",
"market_position_size": 0,
"prev_market_position": "flat",
"prev_market_position_size": 0
}
}
Trading Connector
Trading Connector is a third party fully autonomous Chrome extension designed to catch alert webhooks from TradingView and interface with MT4/MT5 to execute live trades from your machine. Alerts to Trading Connector are simple; just select the destination from the input drop down menu, set your ticker in the "TC Ticker" box in the "Alert Strings" section and enter your URL in the alert window when configuring your alert.
Alertatron
Alertatron is an automated algo platform for cryptocurrency trading that is designed to automate your trading strategies. Although the platform is currently restricted to crypto, it offers a versatile interface with high flexibility syntax for complex market orders and conditions. To direct alerts to Alertatron, select the platform from the 3rd party drop down, configure your API key in the ”Alertatron Key” box and add your URL in the alert message box when making alerts.
3 Commas
3 Commas is an easy and quick to use click-and-go third party crypto API solution. Alerts are simple without overly complex syntax. Messages are simply pasted into alerts and executed as alerts are triggered. There are 4 boxes at the bottom of the "Inputs" tab where the appropriate messages to be placed. These messages can be copied from 3 Commas after the bots are set up and pasted directly into the settings menu. Remember to select 3 Commas as a destination from the third party drop down and place the appropriate URL in the alert message window.
Discord
Some may wish to share their trades with their friends in a Discord chat via webhook chat bot. Messages are configured to notify of the pattern type with targets and stop values. A bot can be configured through the integration menu in a Discord chat to which you have appropriate access. Select Discord from the 3rd party drop down menu and place your chat bot URL in the alert message window when configuring alerts.
👉 For further information regarding alert setup, refer to the platform specific instructions given by the chosen third party provider.
█ IMPORTANT NOTES
Setting Alerts
For alert messages to be properly delivered on order fills it is necessary to place the following placeholder in the alert message box when creating an alert.
{{strategy.order.alert_message}}
This placeholder will auto-populate the alert message with the appropriate syntax that is designated for the 3rd party selected in the user menu.
Order Sizing and Commissions
The values that are sent in alert messages are populated from live metrics calculated by the strategy. This means that the actual values in the "Properties" tab are used and must be set by the user. The initial capital, order size, commission, etc. are all used in the calculations, so it is important to set these prior to executing live trades. Be sure to set the commission to the values used by the exchange as well.
👉 It is important to understand that the calculations on the account size take place from the beginning of the price history of the strategy. This means that if historical results have inflated or depleted the account size from the beginning of trade history until now, the values sent in alerts will reflect the calculated size based on the inputs in the "Properties" tab. To start fresh, the user must set the date in the "Inputs" tab to the current date as to remove trades from the trade history. Failure to follow this instruction can result in an unexpected order size being sent in the alert.
█ FOR PINECODERS
• With the recent introduction of matrices in Pine, the script utilizes a matrix to track pivot points with the bars they occurred on, while tracking if that pivot has been traded against to prevent duplicate detections after a trade is exited.
• Alert messages are populated with placeholders ; capability that previously was only possible in alertcondition() , but has recently been extended to `strategy.*()` functions for use in the `alert_message` argument. This allows delivery of live trade values to populate in strategy alert messages.
• New arguments have been added to strategy.exit() , which allow differentiated messages to be sent based on whether the exit occurred at the stop or the limit. The new arguments used in this script are `alert_profit` and `alert_loss` to send messages to Discord

[TehThomas] - Order Blocks█ OVERVIEW
This Order Blocks indicator identifies institutional-level support and resistance zones using fractal pattern recognition combined with Fair Value Gap (FVG) filtering. Order blocks represent areas where large institutional orders have been placed, creating significant price reactions when retested. This indicator uses a 5-bar fractal pattern to detect market structure breaks and highlights the last bearish or bullish candle before a strong impulse move.
█ KEY FEATURES
- Fractal-Based Detection: Uses 5-candle fractal patterns to identify key market structure highs and lows
- FVG Filtering: Optional Fair Value Gap confirmation ensures order blocks are followed by true market imbalances
- Automatic Mitigation: Order blocks are automatically removed when price breaks through them
- Overlap Prevention: Prevents cluttered charts by avoiding overlapping order block zones
- Customizable Display: Full control over colors, labels, line heights (body/wick), and maximum blocks shown
- Dual Polarity: Detects both bullish (OB+) and bearish (OB-) order blocks independently
█ HOW IT WORKS
The indicator scans price action for fractal patterns where the middle candle forms a local extreme (highest high or lowest low among 5 bars). When price breaks above a fractal high or below a fractal low, the script identifies the last opposing candle in the impulse move as the order block.
For bearish order blocks, it finds the highest bullish candle before a fractal low is broken, marking institutional selling pressure. For bullish order blocks, it locates the lowest bearish candle before a fractal high is breached, indicating institutional buying.
When FVG filtering is enabled, the indicator confirms that a Fair Value Gap (a 3-candle imbalance where price leaves an unfilled gap) occurred within the specified distance from the order block. This combination increases the probability that institutional traders are present in these zones.
█ SETTINGS
Bullish Order Block Settings
- Show/hide bullish order blocks
- Customize fill color and border color
- Toggle OB+ label display
Bearish Order Block Settings
- Show/hide bearish order blocks
- Customize fill color and border color
- Toggle OB- label display
Label Settings
- Label size: Tiny, Small, Normal, or Large
- Label text color customization
General Settings
- Bars Back to Check (10-200): Lookback period for order block detection
- Filter by FVG: Requires Fair Value Gap confirmation
- Max Bars Between OB and FVG (1-6): Distance tolerance for FVG filtering
- Line Height: Choose between Body or Wick for order block boundaries
- Prevent Overlapping OBs: Avoids drawing overlapping zones
- Max Order Blocks to Display (1-50): Limits active blocks on chart
- Length of Boxes (10-100): Horizontal projection length
█ HOW TO USE
1. Add the indicator to your TradingView chart
2. Configure settings based on your trading timeframe and style
3. Watch for OB+ labels (bullish order blocks) as potential support zones where price may bounce
4. Watch for OB- labels (bearish order blocks) as potential resistance zones where price may reverse
5. Wait for price retracement to the order block zone before taking entries
6. Use confirmation signals like volume spikes or reversal patterns at the order block
7. Place stop loss just outside the order block boundary to manage risk
8. Monitor mitigation: Order blocks disappear when price breaks through them completely
█ TRADING STRATEGY EXAMPLES
Bullish Order Block Strategy
Wait for a market structure shift from bearish to bullish. When price creates a bullish impulse breaking a fractal high, identify the OB+ zone. Enter long positions when price retraces to test the bullish order block, placing stop loss 10-20 pips below the zone's low. Target previous highs or resistance levels.
Bearish Order Block Strategy
Monitor for market structure shift from bullish to bearish. After price creates a bearish impulse breaking a fractal low, locate the OB- zone. Enter short positions when price retraces to test the bearish order block, placing stop loss 10-20 pips above the zone's high. Target previous lows or support levels.
FVG-Confirmed Entries
Enable FVG filtering to only display order blocks validated by Fair Value Gaps. These aligned setups increase probability as they combine institutional order placement with market inefficiencies. Trade retracements to these high-confluence zones for better risk-reward ratios.
█ IDEAL FOR
- ICT Traders: Follows Inner Circle Trader methodology for institutional order flow
- Smart Money Concepts: Tracks where large players place orders
- Swing Traders: Identifies key support/resistance for multi-day holds
- Price Action Traders: Pure chart-based approach without lagging indicators
- Breakout Traders: Confirms structure breaks with fractal patterns
- Forex, Crypto, and Stock Markets: Works on all liquid markets and timeframes
█ TECHNICAL SPECIFICATIONS
- Max Boxes: 500
- Max Labels: 500
- Detection Method: 5-bar fractal pattern recognition
- Mitigation Logic: Automatic removal when price breaks order block boundaries
- Time Projection: Uses time offset calculations for box extension
- Array Management: Dynamic array cleanup to prevent memory issues
█ NOTES & DISCLAIMERS
- Order blocks work best when combined with overall market context and trend analysis
- Not all order blocks result in price reversals; use proper risk management
- FVG filtering may reduce the number of signals but increases quality
- Fractal patterns require 5 bars to form, causing a 2-bar delay in detection
- Works optimally on higher timeframes (4H, Daily) for institutional footprints
- This indicator does not guarantee profitable trades; always use stop losses
- Past performance of order blocks does not predict future results
- Compatible with other ICT concepts like liquidity sweeps and market structure

Institutional Levels (CNN) - [PhenLabs]📊Institutional Levels (Convolutional Neural Network-inspired)
Version : PineScript™v6
📌Description
The CNN-IL Institutional Levels indicator represents a breakthrough in automated zone detection technology, combining convolutional neural network principles with advanced statistical modeling. This sophisticated tool identifies high-probability institutional trading zones by analyzing pivot patterns, volume dynamics, and price behavior using machine learning algorithms.
The indicator employs a proprietary 9-factor logistic regression model that calculates real-time reaction probabilities for each detected zone. By incorporating CNN-inspired filtering techniques and dynamic zone management, it provides traders with unprecedented accuracy in identifying where institutional money is likely to react to price action.
🚀Points of Innovation
● CNN-Inspired Pivot Analysis - Advanced binning system using convolutional neural network principles for superior pattern recognition
● Real-Time Probability Engine - Live reaction probability calculations using 9-factor logistic regression model
● Dynamic Zone Intelligence - Automatic zone merging using Intersection over Union (IoU) algorithms
● Volume-Weighted Scoring - Time-of-day volume Z-score analysis for enhanced zone strength assessment
● Adaptive Decay System - Intelligent zone lifecycle management based on touch frequency and recency
● Multi-Filter Architecture - Optional gradient, smoothing, and Difference of Gaussians (DoG) convolution filters
🔧Core Components
● Pivot Detection Engine - Advanced pivot identification with configurable left/right bars and ATR-normalized strength calculations
● Neural Network Binning - Price level clustering using CNN-inspired algorithms with ATR-based bin sizing
● Logistic Regression Model - 9-factor probability calculation including distance, width, volume, VWAP deviation, and trend analysis
● Zone Management System - Intelligent creation, merging, and decay algorithms for optimal zone lifecycle control
● Visualization Layer - Dynamic line drawing with opacity-based scoring and optional zone fills
🔥Key Features
● High-Probability Zone Detection - Automatically identifies institutional levels with reaction probabilities above configurable thresholds
● Real-Time Probability Scoring - Live calculation of zone reaction likelihood using advanced statistical modeling
● Session-Aware Analysis - Optional filtering to specific trading sessions for enhanced accuracy during active market hours
● Customizable Parameters - Full control over lookback periods, zone sensitivity, merge thresholds, and probability models
● Performance Optimized - Efficient processing with controlled update frequencies and pivot processing limits
● Non-Repainting Mode - Strict mode available for backtesting accuracy and live trading reliability
🎨Visualization
● Dynamic Zone Lines - Color-coded support and resistance levels with opacity reflecting zone strength and confidence scores
● Probability Labels - Real-time display of reaction probabilities, touch counts, and historical hit rates for active zones
● Zone Fills - Optional semi-transparent zone highlighting for enhanced visual clarity and immediate pattern recognition
● Adaptive Styling - Automatic color and opacity adjustments based on zone scoring and statistical significance
📖Usage Guidelines
● Lookback Bars - Default 500, Range 100-1000, Controls the historical data window for pivot analysis and zone calculation
● Pivot Left/Right - Default 3, Range 1-10, Defines the pivot detection sensitivity and confirmation requirements
● Bin Size ATR units - Default 0.25, Range 0.1-2.0, Controls price level clustering granularity for zone creation
● Base Zone Half-Width ATR units - Default 0.25, Range 0.1-1.0, Sets the minimum zone width in ATR units for institutional level boundaries
● Zone Merge IoU Threshold - Default 0.5, Range 0.1-0.9, Intersection over Union threshold for automatic zone merging algorithms
● Max Active Zones - Default 5, Range 3-20, Maximum number of zones displayed simultaneously to prevent chart clutter
● Probability Threshold for Labels - Default 0.6, Range 0.3-0.9, Minimum reaction probability required for zone label display and alerts
● Distance Weight w1 - Controls influence of price distance from zone center on reaction probability
● Width Weight w2 - Adjusts impact of zone width on probability calculations
● Volume Weight w3 - Modifies volume Z-score influence on zone strength assessment
● VWAP Weight w4 - Controls VWAP deviation impact on institutional level significance
● Touch Count Weight w5 - Adjusts influence of historical zone interactions on probability scoring
● Hit Rate Weight w6 - Controls prior success rate impact on future reaction likelihood predictions
● Wick Penetration Weight w7 - Modifies wick penetration analysis influence on probability calculations
● Trend Weight w8 - Adjusts trend context impact using ADX analysis for directional bias assessment
✅Best Use Cases
● Swing Trading Entries - Enter positions at high-probability institutional zones with 60%+ reaction scores
● Scalping Opportunities - Quick entries and exits around frequently tested institutional levels
● Risk Management - Use zones as dynamic stop-loss and take-profit levels based on institutional behavior
● Market Structure Analysis - Identify key institutional levels that define current market structure and sentiment
● Confluence Trading - Combine with other technical indicators for high-probability trade setups
● Session-Based Strategies - Focus analysis during high-volume sessions for maximum effectiveness
⚠️Limitations
● Historical Pattern Dependency - Algorithm effectiveness relies on historical patterns that may not repeat in changing market conditions
● Computational Intensity - Complex calculations may impact chart performance on lower-end devices or with multiple indicators
● Probability Estimates - Reaction probabilities are statistical estimates and do not guarantee actual market outcomes
● Session Sensitivity - Performance may vary significantly between different market sessions and volatility regimes
● Parameter Sensitivity - Results can be highly dependent on input parameters requiring optimization for different instruments
💡What Makes This Unique
● CNN Architecture - First indicator to apply convolutional neural network principles to institutional-level detection
● Real-Time ML Scoring - Live machine learning probability calculations for each zone interaction
● Advanced Zone Management - Sophisticated algorithms for zone lifecycle management and automatic optimization
● Statistical Rigor - Comprehensive 9-factor logistic regression model with extensive backtesting validation
● Performance Optimization - Efficient processing algorithms designed for real-time trading applications
🔬How It Works
● Multi-timeframe pivot identification - Uses configurable sensitivity parameters for advanced pivot detection
● ATR-normalized strength calculations - Standardizes pivot significance across different volatility regimes
● Volume Z-score integration - Enhanced pivot weighting based on time-of-day volume patterns
● Price level clustering - Neural network binning algorithms with ATR-based sizing for zone creation
● Recency decay applications - Weights recent pivots more heavily than historical data for relevance
● Statistical filtering - Eliminates low-significance price levels and reduces market noise
● Dynamic zone generation - Creates zones from statistically significant pivot clusters with minimum support thresholds
● IoU-based merging algorithms - Combines overlapping zones while maintaining accuracy using Intersection over Union
● Adaptive decay systems - Automatic removal of outdated or low-performing zones for optimal performance
● 9-factor logistic regression - Incorporates distance, width, volume, VWAP, touch history, and trend analysis
● Real-time scoring updates - Zone interaction calculations with configurable threshold filtering
● Optional CNN filters - Gradient detection, smoothing, and Difference of Gaussians processing for enhanced accuracy
💡Note
This indicator represents advanced quantitative analysis and should be used by traders familiar with statistical modeling concepts. The probability scores are mathematical estimates based on historical patterns and should be combined with proper risk management and additional technical analysis for optimal trading decisions.

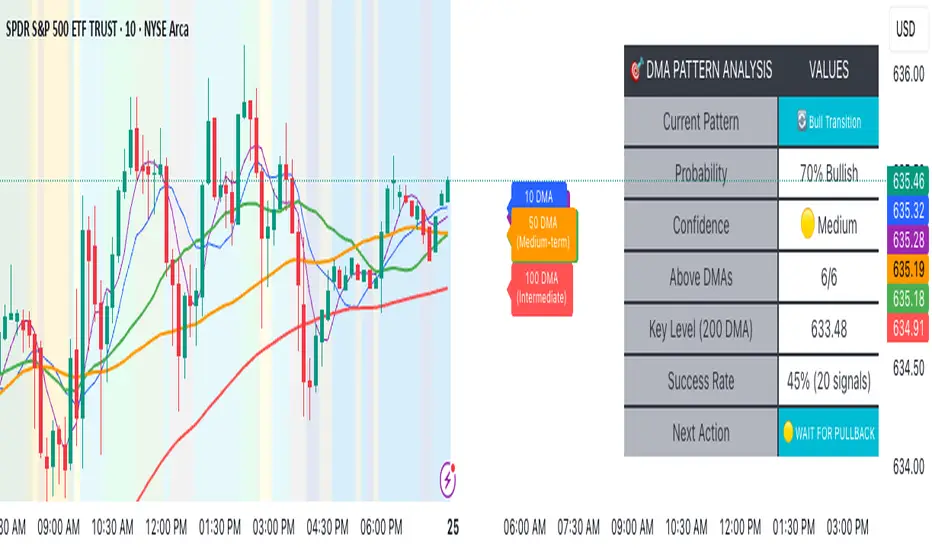
Advanced DMA Pattern Detection SystemAdvanced DMA Pattern Detection System with Smart Intelligence
Professional-grade moving average indicator that combines traditional DMA analysis with advanced pattern recognition and probabilistic forecasting.
Core Features:
6 Key DMAs (5, 10, 20, 50, 100, 200) with descriptive labels showing trading purpose
Advanced Pattern Recognition - Detects Institutional Accumulation, Distribution Phases, Bull/Bear Transitions, and Choppy Markets
Probability Engine - Assigns confidence scores (0-100%) with Low/Medium/High classifications
Historical Validation - Tracks success rate of last 20 pattern signals for real performance data
Smart Alert System - Only triggers on significant pattern changes (20%+ probability shifts)
Dual Display System:
Movable Information Table - Shows current pattern, probability, confidence level, success rate, and recommended action
Chart Alerts & Background Colors - Visual confirmation of high-confidence setups (80%+ patterns)
Traditional DMA Labels - Clear identification of each average's trading significance
Complete Customization:
Master on/off controls for entire system
Individual toggles for all components (DMAs, table, alerts, colors)
Adjustable alert sensitivity (Conservative/Medium/Aggressive)
6 table positions to fit any chart layout
Perfect For: Swing traders, position traders, and anyone wanting systematic trend analysis with quantified probability scores rather than subjective interpretation.
Bottom Line: Transforms basic moving averages into an intelligent trading system that tells you exactly what the market structure means and what to do about it.
Multi-Confluence Swing Hunter V1# Multi-Confluence Swing Hunter V1 - Complete Description
Overview
The Multi-Confluence Swing Hunter V1 is a sophisticated low timeframe scalping strategy specifically optimized for MSTR (MicroStrategy) trading. This strategy employs a comprehensive point-based scoring system that combines optimized technical indicators, price action analysis, and reversal pattern recognition to generate precise trading signals on lower timeframes.
Performance Highlight:
In backtesting on MSTR 5-minute charts, this strategy has demonstrated over 200% profit performance, showcasing its effectiveness in capturing rapid price movements and volatility patterns unique to MicroStrategy's trading behavior.
The strategy's parameters have been fine-tuned for MSTR's unique volatility characteristics, though they can be optimized for other high-volatility instruments as well.
## Key Innovation & Originality
This strategy introduces a unique **dual scoring system** approach:
- **Entry Scoring**: Identifies swing bottoms using 13+ different technical criteria
- **Exit Scoring**: Identifies swing tops using inverse criteria for optimal exit timing
Unlike traditional strategies that rely on simple indicator crossovers, this system quantifies market conditions through a weighted scoring mechanism, providing objective, data-driven entry and exit decisions.
## Technical Foundation
### Optimized Indicator Parameters
The strategy utilizes extensively backtested parameters specifically optimized for MSTR's volatility patterns:
**MACD Configuration (3,10,3)**:
- Fast EMA: 3 periods (vs standard 12)
- Slow EMA: 10 periods (vs standard 26)
- Signal Line: 3 periods (vs standard 9)
- **Rationale**: These faster parameters provide earlier signal detection while maintaining reliability, particularly effective for MSTR's rapid price movements and high-frequency volatility
**RSI Configuration (21-period)**:
- Length: 21 periods (vs standard 14)
- Oversold: 30 level
- Extreme Oversold: 25 level
- **Rationale**: The 21-period RSI reduces false signals while still capturing oversold conditions effectively in MSTR's volatile environment
**Parameter Adaptability**: While optimized for MSTR, these parameters can be adjusted for other high-volatility instruments. Faster-moving stocks may benefit from even shorter MACD periods, while less volatile assets might require longer periods for optimal performance.
### Scoring System Methodology
**Entry Score Components (Minimum 13 points required)**:
1. **RSI Signals** (max 5 points):
- RSI < 30: +2 points
- RSI < 25: +2 points
- RSI turning up: +1 point
2. **MACD Signals** (max 8 points):
- MACD below zero: +1 point
- MACD turning up: +2 points
- MACD histogram improving: +2 points
- MACD bullish divergence: +3 points
3. **Price Action** (max 4 points):
- Long lower wick (>50%): +2 points
- Small body (<30%): +1 point
- Bullish close: +1 point
4. **Pattern Recognition** (max 8 points):
- RSI bullish divergence: +4 points
- Quick recovery pattern: +2 points
- Reversal confirmation: +4 points
**Exit Score Components (Minimum 13 points required)**:
Uses inverse criteria to identify swing tops with similar weighting system.
## Risk Management Features
### Position Sizing & Risk Control
- **Single Position Strategy**: 100% equity allocation per trade
- **No Overlapping Positions**: Ensures focused risk management
- **Configurable Risk/Reward**: Default 5:1 ratio optimized for volatile assets
### Stop Loss & Take Profit Logic
- **Dynamic Stop Loss**: Based on recent swing lows with configurable buffer
- **Risk-Based Take Profit**: Calculated using risk/reward ratio
- **Clean Exit Logic**: Prevents conflicting signals
## Default Settings Optimization
### Key Parameters (Optimized for MSTR/Bitcoin-style volatility):
- **Minimum Entry Score**: 13 (ensures high-conviction entries)
- **Minimum Exit Score**: 13 (prevents premature exits)
- **Risk/Reward Ratio**: 5.0 (accounts for volatility)
- **Lower Wick Threshold**: 50% (identifies true hammer patterns)
- **Divergence Lookback**: 8 bars (optimal for swing timeframes)
### Why These Defaults Work for MSTR:
1. **Higher Score Thresholds**: MSTR's volatility requires more confirmation
2. **5:1 Risk/Reward**: Compensates for wider stops needed in volatile markets
3. **Faster MACD**: Captures momentum shifts quickly in fast-moving stocks
4. **21-period RSI**: Reduces noise while maintaining sensitivity
## Visual Features
### Score Display System
- **Green Labels**: Entry scores ≥10 points (below bars)
- **Red Labels**: Exit scores ≥10 points (above bars)
- **Large Triangles**: Actual trade entries/exits
- **Small Triangles**: Reversal pattern confirmations
### Chart Cleanliness
- Indicators plotted in separate panes (MACD, RSI)
- TP/SL levels shown only during active positions
- Clear trade markers distinguish signals from actual trades
## Backtesting Specifications
### Realistic Trading Conditions
- **Commission**: 0.1% per trade
- **Slippage**: 3 points
- **Initial Capital**: $1,000
- **Account Type**: Cash (no margin)
### Sample Size Considerations
- Strategy designed for 100+ trade sample sizes
- Recommended timeframes: 4H, 1D for swing trading
- Optimal for trending/volatile markets
## Strategy Limitations & Considerations
### Market Conditions
- **Best Performance**: Trending markets with clear swings
- **Reduced Effectiveness**: Highly choppy, sideways markets
- **Volatility Dependency**: Optimized for moderate to high volatility assets
### Risk Warnings
- **High Allocation**: 100% position sizing increases risk
- **No Diversification**: Single position strategy
- **Backtesting Limitation**: Past performance doesn't guarantee future results
## Usage Guidelines
### Recommended Assets & Timeframes
- **Primary Target**: MSTR (MicroStrategy) - 5min to 15min timeframes
- **Secondary Targets**: High-volatility stocks (TSLA, NVDA, COIN, etc.)
- **Crypto Markets**: Bitcoin, Ethereum (with parameter adjustments)
- **Timeframe Optimization**: 1min-15min for scalping, 30min-1H for swing scalping
### Timeframe Recommendations
- **Primary Scalping**: 5-minute and 15-minute charts
- **Active Monitoring**: 1-minute for precise entries
- **Swing Scalping**: 30-minute to 1-hour timeframes
- **Avoid**: Sub-1-minute (excessive noise) and above 4-hour (reduces scalping opportunities)
## Technical Requirements
- **Pine Script Version**: v6
- **Overlay**: Yes (plots on price chart)
- **Additional Panes**: MACD and RSI indicators
- **Real-time Compatibility**: Confirmed bar signals only
## Customization Options
All parameters are fully customizable through inputs:
- Indicator lengths and levels
- Scoring thresholds
- Risk management settings
- Visual display preferences
- Date range filtering
## Conclusion
This scalping strategy represents a comprehensive approach to low timeframe trading that combines multiple technical analysis methods into a cohesive, quantified system specifically optimized for MSTR's unique volatility characteristics. The optimized parameters and scoring methodology provide a systematic way to identify high-probability scalping setups while managing risk effectively in fast-moving markets.
The strategy's strength lies in its objective, multi-criteria approach that removes emotional decision-making from scalping while maintaining the flexibility to adapt to different instruments through parameter optimization. While designed for MSTR, the underlying methodology can be fine-tuned for other high-volatility assets across various markets.
**Important Disclaimer**: This strategy is designed for experienced scalpers and is optimized for MSTR trading. The high-frequency nature of scalping involves significant risk. Past performance does not guarantee future results. Always conduct your own analysis, consider your risk tolerance, and be aware of commission/slippage costs that can significantly impact scalping profitability.

Similar Bars Pattern DetecterDescription:
The Similar Bars Pattern Detector is a professional Pine Script indicator designed for TradingView users who want to identify sequences of similar candlesticks in a row. Whether you're looking for bullish or bearish patterns, this tool helps you spot repeating formations based on customizable settings.
Features:
✅ Detects patterns of consecutive similar bars
✅ Works for both bullish and bearish trends
✅ Uses tick-based range filtering for precise detection
✅ Fully customizable: adjust number of candles, trend type, and range
✅ Highlights detected patterns directly on the chart
🔹 Ideal for traders who rely on pattern recognition to confirm trends and price movements.
🔹 Works across all markets and timeframes.
💡 How to Use:
1️⃣ Set the number of candles to detect a repeating pattern.
2️⃣ Choose bullish or bearish trend direction.
3️⃣ Adjust the tick range to fine-tune pattern similarity.
🚀 Enhance your trading analysis with this powerful pattern recognition tool!

AI Adaptive Oscillator [PhenLabs]📊 Algorithmic Adaptive Oscillator
Version: PineScript™ v6
📌 Description
The AI Adaptive Oscillator is a sophisticated technical indicator that employs ensemble learning and adaptive weighting techniques to analyze market conditions. This innovative oscillator combines multiple traditional technical indicators through an AI-driven approach that continuously evaluates and adjusts component weights based on historical performance. By integrating statistical modeling with machine learning principles, the indicator adapts to changing market dynamics, providing traders with a responsive and reliable tool for market analysis.
🚀 Points of Innovation:
Ensemble learning framework with adaptive component weighting
Performance-based scoring system using directional accuracy
Dynamic volatility-adjusted smoothing mechanism
Intelligent signal filtering with cooldown and magnitude requirements
Signal confidence levels based on multi-factor analysis
🔧 Core Components
Ensemble Framework : Combines up to five technical indicators with performance-weighted integration
Adaptive Weighting : Continuous performance evaluation with automated weight adjustment
Volatility-Based Smoothing : Adapts sensitivity based on current market volatility
Pattern Recognition : Identifies potential reversal patterns with signal qualification criteria
Dynamic Visualization : Professional color schemes with gradient intensity representation
Signal Confidence : Three-tiered confidence assessment for trading signals
🔥 Key Features
The indicator provides comprehensive market analysis through:
Multi-Component Ensemble : Integrates RSI, CCI, Stochastic, MACD, and Volume-weighted momentum
Performance Scoring : Evaluates each component based on directional prediction accuracy
Adaptive Smoothing : Automatically adjusts based on market volatility
Pattern Detection : Identifies potential reversal patterns in overbought/oversold conditions
Signal Filtering : Prevents excessive signals through cooldown periods and minimum change requirements
Confidence Assessment : Displays signal strength through intuitive confidence indicators (average, above average, excellent)
🎨 Visualization
Gradient-Filled Oscillator : Color intensity reflects strength of market movement
Clear Signal Markers : Distinct bullish and bearish pattern signals with confidence indicators
Range Visualization : Clean representation of oscillator values from -6 to 6
Zero Line : Clear demarcation between bullish and bearish territory
Customizable Colors : Color schemes that can be adjusted to match your chart style
Confidence Symbols : Intuitive display of signal confidence (no symbol, +, or ++) alongside direction markers
📖 Usage Guidelines
⚙️ Settings Guide
Color Settings
Bullish Color
Default: #2b62fa (Blue)
This setting controls the color representation for bullish movements in the oscillator. The color appears when the oscillator value is positive (above zero), with intensity indicating the strength of the bullish momentum. A brighter shade indicates stronger bullish pressure.
Bearish Color
Default: #ce9851 (Amber)
This setting determines the color representation for bearish movements in the oscillator. The color appears when the oscillator value is negative (below zero), with intensity reflecting the strength of the bearish momentum. A more saturated shade indicates stronger bearish pressure.
Signal Settings
Signal Cooldown (bars)
Default: 10
Range: 1-50
This parameter sets the minimum number of bars that must pass before a new signal of the same type can be generated. Higher values reduce signal frequency and help prevent overtrading during choppy market conditions. Lower values increase signal sensitivity but may generate more false positives.
Min Change For New Signal
Default: 1.5
Range: 0.5-3.0
This setting defines the minimum required change in oscillator value between consecutive signals of the same type. It ensures that new signals represent meaningful changes in market conditions rather than minor fluctuations. Higher values produce fewer but potentially higher-quality signals, while lower values increase signal frequency.
AI Core Settings
Base Length
Default: 14
Minimum: 2
This fundamental setting determines the primary calculation period for all technical components in the ensemble (RSI, CCI, Stochastic, etc.). It represents the lookback window for each component’s base calculation. Shorter periods create a more responsive but potentially noisier oscillator, while longer periods produce smoother signals with potential lag.
Adaptive Speed
Default: 0.1
Range: 0.01-0.3
Controls how quickly the oscillator adapts to new market conditions through its volatility-adjusted smoothing mechanism. Higher values make the oscillator more responsive to recent price action but potentially more erratic. Lower values create smoother transitions but may lag during rapid market changes. This parameter directly influences the indicator’s adaptiveness to market volatility.
Learning Lookback Period
Default: 150
Minimum: 10
Determines the historical data range used to evaluate each ensemble component’s performance and calculate adaptive weights. This setting controls how far back the AI “learns” from past performance to optimize current signals. Longer periods provide more stable weight distribution but may be slower to adapt to regime changes. Shorter periods adapt more quickly but may overreact to recent anomalies.
Ensemble Size
Default: 5
Range: 2-5
Specifies how many technical components to include in the ensemble calculation.
Understanding The Interaction Between Settings
Base Length and Learning Lookback : The base length determines the reactivity of individual components, while the lookback period determines how their weights are adjusted. These should be balanced according to your timeframe - shorter timeframes benefit from shorter base lengths, while the lookback should generally be 10-15 times the base length for optimal learning.
Adaptive Speed and Signal Cooldown : These settings control sensitivity from different angles. Increasing adaptive speed makes the oscillator more responsive, while reducing signal cooldown increases signal frequency. For conservative trading, keep adaptive speed low and cooldown high; for aggressive trading, do the opposite.
Ensemble Size and Min Change : Larger ensembles provide more stable signals, allowing for a lower minimum change threshold. Smaller ensembles might benefit from a higher threshold to filter out noise.
Understanding Signal Confidence Levels
The indicator provides three distinct confidence levels for both bullish and bearish signals:
Average Confidence (▲ or ▼) : Basic signal that meets the minimum pattern and filtering criteria. These signals indicate potential reversals but with moderate confidence in the prediction. Consider using these as initial alerts that may require additional confirmation.
Above Average Confidence (▲+ or ▼+) : Higher reliability signal with stronger underlying metrics. These signals demonstrate greater consensus among the ensemble components and/or stronger historical performance. They offer increased probability of successful reversals and can be traded with less additional confirmation.
Excellent Confidence (▲++ or ▼++) : Highest quality signals with exceptional underlying metrics. These signals show strong agreement across oscillator components, excellent historical performance, and optimal signal strength. These represent the indicator’s highest conviction trade opportunities and can be prioritized in your trading decisions.
Confidence assessment is calculated through a multi-factor analysis including:
Historical performance of ensemble components
Degree of agreement between different oscillator components
Relative strength of the signal compared to historical thresholds
✅ Best Use Cases:
Identify potential market reversals through oscillator extremes
Filter trade signals based on AI-evaluated component weights
Monitor changing market conditions through oscillator direction and intensity
Confirm trade signals from other indicators with adaptive ensemble validation
Detect early momentum shifts through pattern recognition
Prioritize trading opportunities based on signal confidence levels
Adjust position sizing according to signal confidence (larger for ++ signals, smaller for standard signals)
⚠️ Limitations
Requires sufficient historical data for accurate performance scoring
Ensemble weights may lag during dramatic market condition changes
Higher ensemble sizes require more computational resources
Performance evaluation quality depends on the learning lookback period length
Even high confidence signals should be considered within broader market context
💡 What Makes This Unique
Adaptive Intelligence : Continuously adjusts component weights based on actual performance
Ensemble Methodology : Combines strength of multiple indicators while minimizing individual weaknesses
Volatility-Adjusted Smoothing : Provides appropriate sensitivity across different market conditions
Performance-Based Learning : Utilizes historical accuracy to improve future predictions
Intelligent Signal Filtering : Reduces noise and false signals through sophisticated filtering criteria
Multi-Level Confidence Assessment : Delivers nuanced signal quality information for optimized trading decisions
🔬 How It Works
The indicator processes market data through five main components:
Ensemble Component Calculation :
Normalizes traditional indicators to consistent scale
Includes RSI, CCI, Stochastic, MACD, and volume components
Adapts based on the selected ensemble size
Performance Evaluation :
Analyzes directional accuracy of each component
Calculates continuous performance scores
Determines adaptive component weights
Oscillator Integration :
Combines weighted components into unified oscillator
Applies volatility-based adaptive smoothing
Scales final values to -6 to 6 range
Signal Generation :
Detects potential reversal patterns
Applies cooldown and magnitude filters
Generates clear visual markers for qualified signals
Confidence Assessment :
Evaluates component agreement, historical accuracy, and signal strength
Classifies signals into three confidence tiers (average, above average, excellent)
Displays intuitive confidence indicators (no symbol, +, ++) alongside direction markers
💡 Note:
The AI Adaptive Oscillator performs optimally when used with appropriate timeframe selection and complementary indicators. Its adaptive nature makes it particularly valuable during changing market conditions, where traditional fixed-weight indicators often lose effectiveness. The ensemble approach provides a more robust analysis by leveraging the collective intelligence of multiple technical methodologies. Pay special attention to the signal confidence indicators to optimize your trading decisions - excellent (++) signals often represent the most reliable trade opportunities.

Trading Strategy - Follow The Plan"Trading Strategy - Follow The Plan" is a TradingView indicator specifically crafted for traders dedicated to adhering to a structured approach. It emphasizes the elimination of emotional decision-making by providing clear, actionable steps. This tool allows you to articulate and visually embed your trading strategy directly onto your charts, encompassing your entry plan, exit plan, and any additional notes crucial for maintaining focus and discipline. It's designed to aid in sustaining consistency in your trading executions, ensuring that you remain steadfastly aligned with your predetermined trading methodology.
Features
1. Entry Plan: Allows traders to outline specific criteria for market entry. This could include conditions like divergences on multiple timeframes, specific pattern recognitions, or other entry triggers. The flexibility of this section caters to various trading styles and strategies.
2. Exit Plan: Dedicated to defining exit strategies, this section can include details on profit targets, stop-loss levels, or conditions for position reversal. It serves as a constant reminder of exit strategies during active trades.
3. Notes: A customizable space for traders to jot down essential rules, observations, or reminders. This section is particularly useful for reinforcing risk management practices and maintaining focus on broader trading goals.
4. Visibility Controls: Each section of the trading plan (Entry Plan, Exit Plan, Notes) can be toggled on or off, allowing traders to manage on-screen information and reduce chart clutter.
5. Layout Customization: Users can choose the placement of the trading plan on their chart, with options including Top Right, Top Left, Bottom Right, and Bottom Left. This caters to individual preferences and screen setups.
6. Appearance Customization: The indicator allows for adjustments in text and background colors, and text sizes for titles and content, enhancing readability and personal preference alignment.

VCP Trendline breakoutThe Signal:
Green Triangles indicate the price is approaching the trendline (Watchlist candidate).
Yellow Triangles indicate the price is very tight against the line (Execution imminent).
The Trigger: When price closes above the Grey Dotted Line, the line stops extending. This is your breakout signal.
Indicator Overview
The The VCP Trendline breakout indicator is a sophisticated technical indicator designed for trend followers and breakout traders (O'Neil, Minervini, Wyckoff styles). This script employs a State Machine logic to identify structural Volatility Contraction Patterns (VCP) in real-time.
It automatically detects valid Bases, tracks the "Right Side" construction, identifies nested handles (contractions), and draws precise supply trendlines—while strictly enforcing structural integrity rules (Higher Lows).
Core Logic & Features
1. Smart Base Detection
Trend Filter: The pattern recognition engine only activates when the price is above the 200 SMA, ensuring you are trading with the primary trend.
Base Validation: It identifies a "Base High" (H1) based on a configurable lookback period. It tracks the depth of the base and automatically invalidates the pattern if the drawdown exceeds the user-defined threshold (default 30%).
2. Recursive Nested Trendlines (VCP)
The indicator is capable of drawing Nested Trendlines (recursive resistance). It doesn't just draw a line from the peak; it identifies internal contractions within the base.
H1 (Primary): The main supply line from the top of the base.
H2, H3 (Internal): Trendlines connecting subsequent lower highs (handles) as volatility contracts.
Smart Fan: Includes a "Clean Fan" mode to show only the most relevant, latest trendline per anchor point.
3. Structural Integrity Enforcement (The "Higher Low" Rule)
This is the standout feature of this script. It performs an Anchor Integrity Check on every bar.
In a valid VCP, every contraction must form a Higher Low.
If the price creates a new pivot (H3) but then crashes lower than the previous contraction's floor (H2), the script identifies this as a Structural Failure.
Auto-Deletion: It immediately retroactively deletes the invalid trendlines associated with that failed contraction, keeping your chart clean and free of "ghost" signals.
4. "Right-Side" Logic
Collision Detection: Trendlines are calculated using "Right-Side Clearance." A line is only drawn if the path from the anchor to the new pivot is unobstructed by price action.
Signal Protection: "Watch" and "Near" signals are suppressed during the decline phase (Left Side). They only appear once the "Bottom" (L1) has been confirmed and price is recovering on the Right Side.
5. Proximity Alerts & Breakouts
Watch Zone (Green Triangle): Appears when the Low of the bar is within 8% (configurable) of a valid trendline.
Near Zone (Yellow Triangle): Appears when the Low of the bar is within 4% (configurable) of a valid trendline.
Breakout Stop: Trendlines are dynamic. The moment a bar closes above a trendline, the line stops extending immediately, marking the exact breakout point.
How to Use This Indicator
The Setup: Look for a stock in an uptrend (Price > 200 SMA).
The Construction: Wait for the script to identify the Base High (H1). As the price corrects and begins to recover, you will see Grey Dotted Lines appear, connecting the highs.
The Contraction: Watch for Nested Trendlines. If you see a second or third line form from a lower high (H2, H3), it indicates a tightening of price action (VCP).
Settings Configuration
Moving Averages
21 EMA, 50 SMA, 200 SMA: Built-in reference averages.
Base Settings
H1 Lookback: How many bars back the script looks to find the "Start" of the base (Default: 21). Increase this for longer-term bases.
Sub-High Pivot Bars: Controls the sensitivity of identifying internal highs (handles).
Max Base Depth: If the base drops more than this % (Default: 30%), the structure is considered failed and lines are removed.
Enable Nested Trendlines: Toggle ON to see internal VCP lines (H2, H3). Toggle OFF to see only the main H1 trendline.
Show Only Latest Line: Keeps the chart clean by removing older lines from the same anchor point.
Visuals & Signals
Near/Watch Zone %: Adjust the sensitivity of the Green/Yellow triangles.
Signal Size: Change the size of the triangle markers.
DISCLAIMER
This is an indicator, not a trading system. Apply good risk management and do your own due diligence before putting your hard earned money into anything.
This script is for educational and analytical purposes only. It does not constitute financial advice. Automated pattern recognition has limitations and should always be verified visually.

ULTIMATE ORDER FLOW SYSTEM🔥 ULTIMATE ORDER FLOW SYSTEM
Overview
This comprehensive order flow analysis tool combines **Volume Profile**, **Cumulative Delta**, and **Large Order Detection** to identify high-probability trading setups. The script analyzes institutional order flow patterns and volume distribution to pinpoint key levels where price is likely to react.
📊 Core Components & Methodology
🔥 ULTIMATE ORDER FLOW SYSTEM
Overview
This comprehensive order flow analysis tool combines Volume Profile, Cumulative Delta, and Large Order Detection to identify high-probability trading setups. The script analyzes institutional order flow patterns and volume distribution to pinpoint key levels where price is likely to react.
________________________________________
📊 Core Components & Methodology
1. Volume Profile Analysis
The script constructs a horizontal volume profile by:
• Dividing the price range into configurable rows (default: 20)
• Accumulating volume at each price level over a lookback period (default: 50 bars)
• Separating buy volume (green bars close > open) from sell volume (red bars)
• Identifying three critical levels:
o POC (Point of Control): Price level with highest traded volume - acts as a strong magnet
o VAH/VAL (Value Area High/Low): Contains 70% of total volume - defines fair value zone
o HVN (High Volume Nodes): Resistance zones where institutions accumulated positions
o LVN (Low Volume Nodes): Thin zones that price moves through quickly - ideal targets
Why This Matters: Institutional traders leave footprints through volume. HVN zones show where large players defended levels, making them reliable support/resistance.
________________________________________
2. Cumulative Delta (Order Flow)
Tracks the running total of buying vs selling pressure:
• Bar Delta: Difference between buy and sell volume per candle
• Cumulative Delta: Sum of all bar deltas - shows net directional pressure
• Delta Moving Average: Smoothed delta (20-period) to identify trend
• Delta Divergences:
o Bullish: Price makes lower low, but delta makes higher low (absorption at bottom)
o Bearish: Price makes higher high, but delta makes lower high (exhaustion at top)
How It Works: When cumulative delta trends up while price consolidates, it signals accumulation. Delta divergences reveal when smart money is positioned opposite to retail expectations.
________________________________________
3. Large Order Detection
Identifies institutional-sized orders in real-time:
• Compares current bar volume to 20-period moving average
• Flags orders exceeding 2.5x average volume (configurable multiplier)
• Distinguishes bullish (green circles below) vs bearish (red circles above) large orders
Rationale: Sudden volume spikes at key levels indicate institutional participation - the "fuel" needed for breakouts or reversals.
________________________________________
🎯 Trading Signal Logic
Combined Setup Criteria
The script generates SHORT and LONG signals when multiple conditions align:
SHORT Signal Requirements:
1. Price reaches an HVN resistance zone (within 0.2%)
2. Large sell order detected (volume spike + red candle)
3. Cumulative delta is bearish OR bearish divergence present
4. 10-bar cooldown between signals (prevents overtrading)
LONG Signal Requirements:
1. Price reaches an HVN support zone
2. Large buy order detected (volume spike + green candle)
3. Cumulative delta is bullish OR bullish divergence present
4. 10-bar cooldown enforced
________________________________________
🔧 Customization Options
Setting - Purpose - Recommendation
Volume Profile Rows - Granularity of level detection - 20 (balanced)
Lookback Period - Historical data analyzed - 50 bars (intraday), 200 (swing)
Large Order Multiplier - Sensitivity to volume spikes - 2.5x (standard), 3.5x (conservative)
HVN Threshold - Resistance zone detection - 1.3 (default)
LVN Threshold - Target zone identification - 0.6 (default)
Divergence Lookback - Pivot detection period - 5 bars (responsive)
________________________________________
📈 Dashboard Indicators
The real-time panel displays:
• POC: Current Point of Control price
• Location: Whether price is at HVN resistance
• Orders: Current large buy/sell activity
• Cumulative Δ: Net order flow value + trend direction
• Divergence: Active bullish/bearish divergences
• Bar Strength: % of candle volume that's directional (>65% = strong)
• SETUP: Current trade signal (LONG/SHORT/WAIT)
________________________________________
🎨 Visual System
• Yellow POC Line: Highest volume level - primary pivot
• Blue Value Area Box: Fair value zone (VAH to VAL)
• Red HVN Zones: Resistance/support from institutional accumulation
• Green LVN Zones: Low-liquidity targets for quick moves
• Volume Bars: Green (buy pressure) vs Red (sell pressure) distribution
• Triangles: LONG (green up) and SHORT (red down) entry signals
• Diamonds: Divergence warnings (cyan=bullish, fuchsia=bearish)
________________________________________
💡 How This Script Is Unique
Unlike standalone volume profile or delta indicators, this script:
1. Synthesizes three complementary methods - volume structure, order flow momentum, and liquidity detection
2. Requires multi-factor confirmation - signals only trigger when price, volume, and delta align at key zones
3. Adapts to market regime - delta filters ensure you're trading with the dominant order flow direction
4. Provides context, not just signals - the dashboard helps you understand why a setup is forming
________________________________________
⚙️ Best Practices
Timeframes:
• 5-15 min: Scalping (use 30-50 bar lookback)
• 1-4 hour: Swing trading (use 100-200 bar lookback)
Risk Management:
• Enter on signal candle close
• Stop loss: Beyond nearest HVN/LVN zone
• Target 1: Next LVN level
• Target 2: Opposite value area boundary
Filters:
• Avoid signals during major news events
• Require bar delta strength >65% for aggressive entries
• Wait for delta MA cross confirmation in ranging markets
________________________________________
🚨 Alerts Available
• Long Setup Trigger
• Short Setup Trigger
• Bullish/Bearish Divergence Detection
• Large Buy/Sell Order Execution
________________________________________
📚 Educational Context
This methodology is based on principles used by professional order flow traders:
• Market Profile Theory: Volume distribution reveals fair value
• Tape Reading: Large orders show institutional intent
• Auction Theory: Price seeks areas of liquidity imbalance (LVN zones)
The script automates pattern recognition that discretionary traders spend years learning to identify manually.
________________________________________
⚠️ Disclaimer
This indicator is a trading tool, not a trading system. It identifies high-probability setups based on order flow analysis but requires proper risk management, market context, and trader discretion. Past performance does not guarantee future results.
________________________________________
Version: 6 (Pine Script)
Type: Overlay + Separate Pane (Delta Panel)
Resource Usage: Moderate (500 bars history, 500 lines/boxes)
________________________________________
For questions or support, please comment below. If you find this script valuable, please boost and favorite! 🚀
1. Volume Profile Analysis
The script constructs a horizontal volume profile by:
- Dividing the price range into configurable rows (default: 20)
- Accumulating volume at each price level over a lookback period (default: 50 bars)
- Separating buy volume (green bars close > open) from sell volume (red bars)
- Identifying three critical levels:
- POC (Point of Control): Price level with highest traded volume - acts as a strong magnet
- VAH/VAL (Value Area High/Low): Contains 70% of total volume - defines fair value zone
- HVN (High Volume Nodes): Resistance zones where institutions accumulated positions
- LVN (Low Volume Nodes): Thin zones that price moves through quickly - ideal targets
Why This Matters: Institutional traders leave footprints through volume. HVN zones show where large players defended levels, making them reliable support/resistance.
---
2. Cumulative Delta (Order Flow)
Tracks the running total of buying vs selling pressure:
- **Bar Delta**: Difference between buy and sell volume per candle
- **Cumulative Delta**: Sum of all bar deltas - shows net directional pressure
- **Delta Moving Average**: Smoothed delta (20-period) to identify trend
- **Delta Divergences**:
- **Bullish**: Price makes lower low, but delta makes higher low (absorption at bottom)
- **Bearish**: Price makes higher high, but delta makes lower high (exhaustion at top)
**How It Works**: When cumulative delta trends up while price consolidates, it signals accumulation. Delta divergences reveal when smart money is positioned opposite to retail expectations.
---
### 3. **Large Order Detection**
Identifies **institutional-sized orders** in real-time:
- Compares current bar volume to 20-period moving average
- Flags orders exceeding 2.5x average volume (configurable multiplier)
- Distinguishes bullish (green circles below) vs bearish (red circles above) large orders
**Rationale**: Sudden volume spikes at key levels indicate institutional participation - the "fuel" needed for breakouts or reversals.
---
## 🎯 Trading Signal Logic
### Combined Setup Criteria
The script generates **SHORT** and **LONG** signals when multiple conditions align:
**SHORT Signal Requirements:**
1. Price reaches an HVN resistance zone (within 0.2%)
2. Large sell order detected (volume spike + red candle)
3. Cumulative delta is bearish OR bearish divergence present
4. 10-bar cooldown between signals (prevents overtrading)
**LONG Signal Requirements:**
1. Price reaches an HVN support zone
2. Large buy order detected (volume spike + green candle)
3. Cumulative delta is bullish OR bullish divergence present
4. 10-bar cooldown enforced
---
## 🔧 Customization Options
| Setting | Purpose | Recommendation |
|---------|---------|----------------|
| **Volume Profile Rows** | Granularity of level detection | 20 (balanced) |
| **Lookback Period** | Historical data analyzed | 50 bars (intraday), 200 (swing) |
| **Large Order Multiplier** | Sensitivity to volume spikes | 2.5x (standard), 3.5x (conservative) |
| **HVN Threshold** | Resistance zone detection | 1.3 (default) |
| **LVN Threshold** | Target zone identification | 0.6 (default) |
| **Divergence Lookback** | Pivot detection period | 5 bars (responsive) |
---
## 📈 Dashboard Indicators
The real-time panel displays:
- **POC**: Current Point of Control price
- **Location**: Whether price is at HVN resistance
- **Orders**: Current large buy/sell activity
- **Cumulative Δ**: Net order flow value + trend direction
- **Divergence**: Active bullish/bearish divergences
- **Bar Strength**: % of candle volume that's directional (>65% = strong)
- **SETUP**: Current trade signal (LONG/SHORT/WAIT)
---
## 🎨 Visual System
- **Yellow POC Line**: Highest volume level - primary pivot
- **Blue Value Area Box**: Fair value zone (VAH to VAL)
- **Red HVN Zones**: Resistance/support from institutional accumulation
- **Green LVN Zones**: Low-liquidity targets for quick moves
- **Volume Bars**: Green (buy pressure) vs Red (sell pressure) distribution
- **Triangles**: LONG (green up) and SHORT (red down) entry signals
- **Diamonds**: Divergence warnings (cyan=bullish, fuchsia=bearish)
---
## 💡 How This Script Is Unique
Unlike standalone volume profile or delta indicators, this script:
1. **Synthesizes three complementary methods** - volume structure, order flow momentum, and liquidity detection
2. **Requires multi-factor confirmation** - signals only trigger when price, volume, and delta align at key zones
3. **Adapts to market regime** - delta filters ensure you're trading with the dominant order flow direction
4. **Provides context, not just signals** - the dashboard helps you understand *why* a setup is forming
---
## ⚙️ Best Practices
**Timeframes:**
- 5-15 min: Scalping (use 30-50 bar lookback)
- 1-4 hour: Swing trading (use 100-200 bar lookback)
**Risk Management:**
- Enter on signal candle close
- Stop loss: Beyond nearest HVN/LVN zone
- Target 1: Next LVN level
- Target 2: Opposite value area boundary
**Filters:**
- Avoid signals during major news events
- Require bar delta strength >65% for aggressive entries
- Wait for delta MA cross confirmation in ranging markets
---
## 🚨 Alerts Available
- Long Setup Trigger
- Short Setup Trigger
- Bullish/Bearish Divergence Detection
- Large Buy/Sell Order Execution
---
## 📚 Educational Context
This methodology is based on principles used by professional order flow traders:
- **Market Profile Theory**: Volume distribution reveals fair value
- **Tape Reading**: Large orders show institutional intent
- **Auction Theory**: Price seeks areas of liquidity imbalance (LVN zones)
The script automates pattern recognition that discretionary traders spend years learning to identify manually.
---
## ⚠️ Disclaimer
This indicator is a **trading tool, not a trading system**. It identifies high-probability setups based on order flow analysis but requires proper risk management, market context, and trader discretion. Past performance does not guarantee future results.
---
**Version**: 6 (Pine Script)
**Type**: Overlay + Separate Pane (Delta Panel)
**Resource Usage**: Moderate (500 bars history, 500 lines/boxes)
---
*For questions or support, please comment below. If you find this script valuable, please boost and favorite!* 🚀

TrendMaster V2TrendMaster V2 is a comprehensive Pine Script indicator designed for TradingView. It combines multiple technical indicators and an advanced scoring logic to provide actionable trading signals. The script is highly customizable, allowing users to adjust trading modes, color themes, and signal filters according to their preferences and risk tolerance.
Key Features
Composite Scoring System:
The script calculates a composite score based on trend, momentum, pattern recognition, volume, volatility, divergence, Pearson correlation, and the CCI index. This score helps identify the best buy or sell opportunities.
Customizable Parameters:
Users can choose between “Aggressive,” “Balanced,” or “Conservative” trading modes, adjust indicator periods, and customize the color scheme of all visual elements.
Confluence Analysis:
The script evaluates the number of matching bullish or bearish signals, providing a confluence summary for higher-confidence trades.
Visual Signals:
Clear visual cues (triangles, circles, crosses) are displayed on the chart for strong buy/sell signals, confluences, and divergences.
Information Panels:
Two panels display real-time data such as score, RSI, volume, volatility, Pearson, CCI, trend, signal, and mode, along with the confluence status for quick reference.
Alert Conditions:
The script supports alerts for strong buy/sell signals, confluences, and divergences.
How It Works
Main Configuration:
Users select a trading mode (Aggressive, Balanced, or Conservative) and a color theme (Dark or Light).
Custom colors can also be set for bullish, bearish, strong, neutral, and signal elements.
Technical Indicators
Moving Averages (SMA/EMA) for trend analysis.
RSI to assess momentum and overbought/oversold conditions.
MACD for trend confirmation.
Volume and Volatility (ATR) for market activity evaluation.
Advanced Indicators
Pearson Correlation to measure trend strength.
CCI for cyclic momentum analysis.
Pattern Recognition
The script identifies common bullish and bearish reversal patterns (e.g., engulfing, hammer, morning/evening star) and continuation patterns (e.g., three white soldiers/black crows).
Composite Score
Each indicator contributes to a composite score, weighted according to the selected trading mode.
The score determines the strength of buy/sell signals.
Confluence Analysis
The script counts the number of matching bullish or bearish signals, providing a confluence summary for higher-confidence trades.
Visual Signals and Alerts
Strong buy/sell signals: triangles
Confluence signals: circles
Divergences: crosses
Alerts are triggered for strong buy/sell signals, confluences, and divergences.
Usage Instructions
Add the script to your TradingView chart.
Adjust the settings in the configuration panel to match your trading style.
Monitor the information panels and visual signals to spot trading opportunities.
Set up alerts for your preferred signal types.

Cycle-Synced Channel Breakout📌 Cycle-Synced Channel Breakout – Detect Breakouts Confirmed by Candles and Momentum Cycles
📖 Overview
The Cycle-Synced Channel Breakout indicator is a precision breakout detection tool that combines the power of:
• Adaptive Keltner Channels
• Dominant Cycle Period Analysis (Ehlers-inspired)
• Candlestick Pattern Recognition (Engulfing)
This multi-layered approach helps identify true breakout opportunities by filtering out noise and false signals, making it ideal for swing traders and intraday traders seeking high-probability directional moves.
⚙️ How It Works
1. Keltner Channel Envelope
A dynamic volatility channel based on the EMA and ATR defines the upper and lower bounds of price movement.
2. Engulfing Candle Detection
The script detects strong bullish and bearish engulfing patterns, which often signal trend reversals or momentum continuations.
3. Dominant Cycle Momentum (Ehlers-inspired)
Using a smoothed power oscillator derived from a detrended price series, the indicator assesses whether momentum is accelerating during the breakout — filtering out weak moves.
4. Signal Confirmation Logic
A signal is only shown when:
• An engulfing pattern is detected, and
• Price breaks out of the Keltner Channel, and
• Momentum (cycle power) is rising
5. Visual Feedback
• Breakout signals are plotted with “BUY” or “SELL” labels
• Faded green/red background highlights confirmed breakouts
• Optional display of engulfing candles with triangle markers
⸻
🛠️ Key Features
• ✅ Adaptive Keltner Channels
• ✅ Bullish/Bearish Engulfing Candle Recognition
• ✅ Ehlers-style Cycle Momentum Confirmation
• ✅ Background highlights for confirmed breakouts
• ✅ Optional candle pattern visualization
• ✅ Lightweight and Pine v6 compatible
⸻
🧪 Inputs
• Keltner Length – EMA period for channel basis
• Multiplier – Multiplied with ATR to determine band width
• Cycle Lookback – Used to calculate smoothed cycle power
• Show Engulfing Candles? – Toggles candlestick signals
• Show Breakout Signals? – Toggles breakout labels and backgrounds
⸻
🧠 How to Use
• Look for “BUY” or “SELL” labels when:
• An engulfing candle breaks through the Keltner Channel
• Cycle momentum confirms strength behind the move
• The background color will faintly highlight the breakout direction.
• Use in combination with other trend or volume indicators for added confluence.
🔒 Notes
• This indicator is not repainting.
• It is designed for educational and research purposes only.
• Works across all timeframes and asset classes (stocks, crypto, forex, etc.)

Langlands-Operadic Möbius Vortex (LOMV)Langlands-Operadic Möbius Vortex (LOMV)
Where Pure Mathematics Meets Market Reality
A Revolutionary Synthesis of Number Theory, Category Theory, and Market Dynamics
🎓 THEORETICAL FOUNDATION
The Langlands-Operadic Möbius Vortex represents a groundbreaking fusion of three profound mathematical frameworks that have never before been combined for market analysis:
The Langlands Program: Harmonic Analysis in Markets
Developed by Robert Langlands (Fields Medal recipient), the Langlands Program creates bridges between number theory, algebraic geometry, and harmonic analysis. In our indicator:
L-Function Implementation:
- Utilizes the Möbius function μ(n) for weighted price analysis
- Applies Riemann zeta function convergence principles
- Calculates quantum harmonic resonance between -2 and +2
- Measures deep mathematical patterns invisible to traditional analysis
The L-Function core calculation employs:
L_sum = Σ(return_val × μ(n) × n^(-s))
Where s is the critical strip parameter (0.5-2.5), controlling mathematical precision and signal smoothness.
Operadic Composition Theory: Multi-Strategy Democracy
Category theory and operads provide the mathematical framework for composing multiple trading strategies into a unified signal. This isn't simple averaging - it's mathematical composition using:
Strategy Composition Arity (2-5 strategies):
- Momentum analysis via RSI transformation
- Mean reversion through Bollinger Band mathematics
- Order Flow Polarity Index (revolutionary T3-smoothed volume analysis)
- Trend detection using Directional Movement
- Higher timeframe momentum confirmation
Agreement Threshold System: Democratic voting where strategies must reach consensus before signal generation. This prevents false signals during market uncertainty.
Möbius Function: Number Theory in Action
The Möbius function μ(n) forms the mathematical backbone:
- μ(n) = 1 if n is a square-free positive integer with even number of prime factors
- μ(n) = -1 if n is a square-free positive integer with odd number of prime factors
- μ(n) = 0 if n has a squared prime factor
This creates oscillating weights that reveal hidden market periodicities and harmonic structures.
🔧 COMPREHENSIVE INPUT SYSTEM
Langlands Program Parameters
Modular Level N (5-50, default 30):
Primary lookback for quantum harmonic analysis. Optimized by timeframe:
- Scalping (1-5min): 15-25
- Day Trading (15min-1H): 25-35
- Swing Trading (4H-1D): 35-50
- Asset-specific: Crypto 15-25, Stocks 30-40, Forex 35-45
L-Function Critical Strip (0.5-2.5, default 1.5):
Controls Riemann zeta convergence precision:
- Higher values: More stable, smoother signals
- Lower values: More reactive, catches quick moves
- High frequency: 0.8-1.2, Medium: 1.3-1.7, Low: 1.8-2.3
Frobenius Trace Period (5-50, default 21):
Galois representation lookback for price-volume correlation:
- Measures harmonic relationships in market flows
- Scalping: 8-15, Day Trading: 18-25, Swing: 25-40
HTF Multi-Scale Analysis:
Higher timeframe context prevents trading against major trends:
- Provides market bias and filters signals
- Improves win rates by 15-25% through trend alignment
Operadic Composition Parameters
Strategy Composition Arity (2-5, default 4):
Number of algorithms composed for final signal:
- Conservative: 4-5 strategies (higher confidence)
- Moderate: 3-4 strategies (balanced approach)
- Aggressive: 2-3 strategies (more frequent signals)
Category Agreement Threshold (2-5, default 3):
Democratic voting minimum for signal generation:
- Higher agreement: Fewer but higher quality signals
- Lower agreement: More signals, potential false positives
Swiss-Cheese Mixing (0.1-0.5, default 0.382):
Golden ratio φ⁻¹ based blending of trend factors:
- 0.382 is φ⁻¹, optimal for natural market fractals
- Higher values: Stronger trend following
- Lower values: More contrarian signals
OFPI Configuration:
- OFPI Length (5-30, default 14): Order Flow calculation period
- T3 Smoothing (3-10, default 5): Advanced exponential smoothing
- T3 Volume Factor (0.5-1.0, default 0.7): Smoothing aggressiveness control
Unified Scoring System
Component Weights (sum ≈ 1.0):
- L-Function Weight (0.1-0.5, default 0.3): Mathematical harmony emphasis
- Galois Rank Weight (0.1-0.5, default 0.2): Market structure complexity
- Operadic Weight (0.1-0.5, default 0.3): Multi-strategy consensus
- Correspondence Weight (0.1-0.5, default 0.2): Theory-practice alignment
Signal Threshold (0.5-10.0, default 5.0):
Quality filter producing:
- 8.0+: EXCEPTIONAL signals only
- 6.0-7.9: STRONG signals
- 4.0-5.9: MODERATE signals
- 2.0-3.9: WEAK signals
🎨 ADVANCED VISUAL SYSTEM
Multi-Dimensional Quantum Aura Bands
Five-layer resonance field showing market energy:
- Colors: Theme-matched gradients (Quantum purple, Holographic cyan, etc.)
- Expansion: Dynamic based on score intensity and volatility
- Function: Multi-timeframe support/resistance zones
Morphism Flow Portals
Category theory visualization showing market topology:
- Green/Cyan Portals: Bullish mathematical flow
- Red/Orange Portals: Bearish mathematical flow
- Size/Intensity: Proportional to signal strength
- Recursion Depth (1-8): Nested patterns for flow evolution
Fractal Grid System
Dynamic support/resistance with projected L-Scores:
- Multiple Timeframes: 10, 20, 30, 40, 50-period highs/lows
- Smart Spacing: Prevents level overlap using ATR-based minimum distance
- Projections: Estimated signal scores when price reaches levels
- Usage: Precise entry/exit timing with mathematical confirmation
Wick Pressure Analysis
Rejection level prediction using candle mathematics:
- Upper Wicks: Selling pressure zones (purple/red lines)
- Lower Wicks: Buying pressure zones (purple/green lines)
- Glow Intensity (1-8): Visual emphasis and line reach
- Application: Confluence with fractal grid creates high-probability zones
Regime Intensity Heatmap
Background coloring showing market energy:
- Black/Dark: Low activity, range-bound markets
- Purple Glow: Building momentum and trend development
- Bright Purple: High activity, strong directional moves
- Calculation: Combines trend, momentum, volatility, and score intensity
Six Professional Themes
- Quantum: Purple/violet for general trading and mathematical focus
- Holographic: Cyan/magenta optimized for cryptocurrency markets
- Crystalline: Blue/turquoise for conservative, stability-focused trading
- Plasma: Gold/magenta for high-energy volatility trading
- Cosmic Neon: Bright neon colors for maximum visibility and aggressive trading
📊 INSTITUTIONAL-GRADE DASHBOARD
Unified AI Score Section
- Total Score (-10 to +10): Primary decision metric
- >5: Strong bullish signals
- <-5: Strong bearish signals
- Quality ratings: EXCEPTIONAL > STRONG > MODERATE > WEAK
- Component Analysis: Individual L-Function, Galois, Operadic, and Correspondence contributions
Order Flow Analysis
Revolutionary OFPI integration:
- OFPI Value (-100% to +100%): Real buying vs selling pressure
- Visual Gauge: Horizontal bar chart showing flow intensity
- Momentum Status: SHIFTING, ACCELERATING, STRONG, MODERATE, or WEAK
- Trading Application: Flow shifts often precede major moves
Signal Performance Tracking
- Win Rate Monitoring: Real-time success percentage with emoji indicators
- Signal Count: Total signals generated for frequency analysis
- Current Position: LONG, SHORT, or NONE with P&L tracking
- Volatility Regime: HIGH, MEDIUM, or LOW classification
Market Structure Analysis
- Möbius Field Strength: Mathematical field oscillation intensity
- CHAOTIC: High complexity, use wider stops
- STRONG: Active field, normal position sizing
- MODERATE: Balanced conditions
- WEAK: Low activity, consider smaller positions
- HTF Trend: Higher timeframe bias (BULL/BEAR/NEUTRAL)
- Strategy Agreement: Multi-algorithm consensus level
Position Management
When in trades, displays:
- Entry Price: Original signal price
- Current P&L: Real-time percentage with risk level assessment
- Duration: Bars in trade for timing analysis
- Risk Level: HIGH/MEDIUM/LOW based on current exposure
🚀 SIGNAL GENERATION LOGIC
Balanced Long/Short Architecture
The indicator generates signals through multiple convergent pathways:
Long Entry Conditions:
- Score threshold breach with algorithmic agreement
- Strong bullish order flow (OFPI > 0.15) with positive composite signal
- Bullish pattern recognition with mathematical confirmation
- HTF trend alignment with momentum shifting
- Extreme bullish OFPI (>0.3) with any positive score
Short Entry Conditions:
- Score threshold breach with bearish agreement
- Strong bearish order flow (OFPI < -0.15) with negative composite signal
- Bearish pattern recognition with mathematical confirmation
- HTF trend alignment with momentum shifting
- Extreme bearish OFPI (<-0.3) with any negative score
Exit Logic:
- Score deterioration below continuation threshold
- Signal quality degradation
- Opposing order flow acceleration
- 10-bar minimum between signals prevents overtrading
⚙️ OPTIMIZATION GUIDELINES
Asset-Specific Settings
Cryptocurrency Trading:
- Modular Level: 15-25 (capture volatility)
- L-Function Precision: 0.8-1.3 (reactive to price swings)
- OFPI Length: 10-20 (fast correlation shifts)
- Cascade Levels: 5-7, Theme: Holographic
Stock Index Trading:
- Modular Level: 25-35 (balanced trending)
- L-Function Precision: 1.5-1.8 (stable patterns)
- OFPI Length: 14-20 (standard correlation)
- Cascade Levels: 4-5, Theme: Quantum
Forex Trading:
- Modular Level: 35-45 (smooth trends)
- L-Function Precision: 1.6-2.1 (high smoothing)
- OFPI Length: 18-25 (disable volume amplification)
- Cascade Levels: 3-4, Theme: Crystalline
Timeframe Optimization
Scalping (1-5 minute charts):
- Reduce all lookback parameters by 30-40%
- Increase L-Function precision for noise reduction
- Enable all visual elements for maximum information
- Use Small dashboard to save screen space
Day Trading (15 minute - 1 hour):
- Use default parameters as starting point
- Adjust based on market volatility
- Normal dashboard provides optimal information density
- Focus on OFPI momentum shifts for entries
Swing Trading (4 hour - Daily):
- Increase lookback parameters by 30-50%
- Higher L-Function precision for stability
- Large dashboard for comprehensive analysis
- Emphasize HTF trend alignment
🏆 ADVANCED TRADING STRATEGIES
The Mathematical Confluence Method
1. Wait for Fractal Grid level approach
2. Confirm with projected L-Score > threshold
3. Verify OFPI alignment with direction
4. Enter on portal signal with quality ≥ STRONG
5. Exit on score deterioration or opposing flow
The Regime Trading System
1. Monitor Aether Flow background intensity
2. Trade aggressively during bright purple periods
3. Reduce position size during dark periods
4. Use Möbius Field strength for stop placement
5. Align with HTF trend for maximum probability
The OFPI Momentum Strategy
1. Watch for momentum shifting detection
2. Confirm with accelerating flow in direction
3. Enter on immediate portal signal
4. Scale out at Fibonacci levels
5. Exit on flow deceleration or reversal
⚠️ RISK MANAGEMENT INTEGRATION
Mathematical Position Sizing
- Use Galois Rank for volatility-adjusted sizing
- Möbius Field strength determines stop width
- Fractal Dimension guides maximum exposure
- OFPI momentum affects entry timing
Signal Quality Filtering
- Trade only STRONG or EXCEPTIONAL quality signals
- Increase position size with higher agreement levels
- Reduce risk during CHAOTIC Möbius field periods
- Respect HTF trend alignment for directional bias
🔬 DEVELOPMENT JOURNEY
Creating the LOMV was an extraordinary mathematical undertaking that pushed the boundaries of what's possible in technical analysis. This indicator almost didn't happen. The theoretical complexity nearly proved insurmountable.
The Mathematical Challenge
Implementing the Langlands Program required deep research into:
- Number theory and the Möbius function
- Riemann zeta function convergence properties
- L-function analytical continuation
- Galois representations in finite fields
The mathematical literature spans decades of pure mathematics research, requiring translation from abstract theory to practical market application.
The Computational Complexity
Operadic composition theory demanded:
- Category theory implementation in Pine Script
- Multi-dimensional array management for strategy composition
- Real-time democratic voting algorithms
- Performance optimization for complex calculations
The Integration Breakthrough
Bringing together three disparate mathematical frameworks required:
- Novel approaches to signal weighting and combination
- Revolutionary Order Flow Polarity Index development
- Advanced T3 smoothing implementation
- Balanced signal generation preventing directional bias
Months of intensive research culminated in breakthrough moments when the mathematics finally aligned with market reality. The result is an indicator that reveals market structure invisible to conventional analysis while maintaining practical trading utility.
🎯 PRACTICAL IMPLEMENTATION
Getting Started
1. Apply indicator with default settings
2. Select appropriate theme for your markets
3. Observe dashboard metrics during different market conditions
4. Practice signal identification without trading
5. Gradually adjust parameters based on observations
Signal Confirmation Process
- Never trade on score alone - verify quality rating
- Confirm OFPI alignment with intended direction
- Check fractal grid level proximity for timing
- Ensure Möbius field strength supports position size
- Validate against HTF trend for bias confirmation
Performance Monitoring
- Track win rate in dashboard for strategy assessment
- Monitor component contributions for optimization
- Adjust threshold based on desired signal frequency
- Document performance across different market regimes
🌟 UNIQUE INNOVATIONS
1. First Integration of Langlands Program mathematics with practical trading
2. Revolutionary OFPI with T3 smoothing and momentum detection
3. Operadic Composition using category theory for signal democracy
4. Dynamic Fractal Grid with projected L-Score calculations
5. Multi-Dimensional Visualization through morphism flow portals
6. Regime-Adaptive Background showing market energy intensity
7. Balanced Signal Generation preventing directional bias
8. Professional Dashboard with institutional-grade metrics
📚 EDUCATIONAL VALUE
The LOMV serves as both a practical trading tool and an educational gateway to advanced mathematics. Traders gain exposure to:
- Pure mathematics applications in markets
- Category theory and operadic composition
- Number theory through Möbius function implementation
- Harmonic analysis via L-function calculations
- Advanced signal processing through T3 smoothing
⚖️ RESPONSIBLE USAGE
This indicator represents advanced mathematical research applied to market analysis. While the underlying mathematics are rigorously implemented, markets remain inherently unpredictable.
Key Principles:
- Use as part of comprehensive trading strategy
- Implement proper risk management at all times
- Backtest thoroughly before live implementation
- Understand that past performance does not guarantee future results
- Never risk more than you can afford to lose
The mathematics reveal deep market structure, but successful trading requires discipline, patience, and sound risk management beyond any indicator.
🔮 CONCLUSION
The Langlands-Operadic Möbius Vortex represents a quantum leap forward in technical analysis, bringing PhD-level pure mathematics to practical trading while maintaining visual elegance and usability.
From the harmonic analysis of the Langlands Program to the democratic composition of operadic theory, from the number-theoretic precision of the Möbius function to the revolutionary Order Flow Polarity Index, every component works in mathematical harmony to reveal the hidden order within market chaos.
This is more than an indicator - it's a mathematical lens that transforms how you see and understand market structure.
Trade with mathematical precision. Trade with the LOMV.
*"Mathematics is the language with which God has written the universe." - Galileo Galilei*
*In markets, as in nature, profound mathematical beauty underlies apparent chaos. The LOMV reveals this hidden order.*
— Dskyz, Trade with insight. Trade with anticipation.

Dskyz (DAFE) AI Adaptive Regime - Beginners VersionDskyz (DAFE) AI Adaptive Regime - Pro: Revolutionizing Trading for All
Introduction
In the fast-paced world of financial markets, traders need tools that can keep up with ever-changing conditions while remaining accessible. The Dskyz (DAFE) AI Adaptive Regime - Pro is a groundbreaking TradingView strategy that delivers advanced, AI-driven trading capabilities to everyday traders. Available on TradingView (TradingView Scripts), this Pine Script strategy combines sophisticated market analysis with user-friendly features, making it a standout choice for both novice and experienced traders.
Core Functionality
The strategy is built to adapt to different market regimes—trending, ranging, volatile, or quiet—using a robust set of technical indicators, including:
Moving Averages (MA): Fast and slow EMAs to detect trend direction.
Average True Range (ATR): For dynamic stop-loss and volatility assessment.
Relative Strength Index (RSI) and MACD: Multi-timeframe confirmation of momentum and trend.
Average Directional Index (ADX): To identify trending markets.
Bollinger Bands: For assessing volatility and range conditions.
Candlestick Patterns: Recognizes patterns like bullish engulfing, hammer, and double bottoms, confirmed by volume spikes.
It generates buy and sell signals based on a scoring system that weighs these indicators, ensuring trades align with the current market environment. The strategy also includes dynamic risk management with ATR-based stops and trailing stops, as well as performance tracking to optimize future trades.
What Sets It Apart
The Dskyz (DAFE) AI Adaptive Regime - Pro distinguishes itself from other TradingView strategies through several unique features, which we compare to common alternatives below:
| Feature | Dskyz (DAFE) | Typical TradingView Strategies|
|---------|-------------|------------------------------------------------------------|
| Regime Detection | Automatically identifies and adapts to **four** market regimes | Often static or limited to trend/range detection |
| Multi‑Timeframe Analysis | Uses higher‑timeframe RSI/MACD for confirmation | Rarely incorporates multi‑timeframe data |
| Pattern Recognition | Detects candlestick patterns **with volume confirmation** | Limited or no pattern recognition |
| Dynamic Risk Management | ATR‑based stops and trailing stops | Often uses fixed stops or basic risk rules |
| Performance Tracking | Adjusts thresholds based on past performance | Typically static parameters |
| Beginner‑Friendly Presets | Aggressive, Conservative, Optimized profiles | Requires manual parameter tuning |
| Visual Cues | Color‑coded backgrounds for regimes | Basic or no visual aids |
The Dskyz strategy’s ability to integrate regime detection, multi-timeframe analysis, and user-friendly presets makes it uniquely versatile and accessible, addressing the needs of everyday traders who want professional-grade tools without the complexity.
-Key Features and Benefits
[Why It’s Ideal for Everyday Traders
⚡The Dskyz (DAFE) AI Adaptive Regime - Pro democratizes advanced trading by offering professional-grade tools in an accessible package. Unlike many TradingView strategies that require deep technical knowledge or fail in changing market conditions, this strategy simplifies complex analysis while maintaining robustness. Its presets and visual aids make it easy for beginners to start, while its adaptive features and performance tracking appeal to advanced traders seeking an edge.
🔄Limitations and Considerations
Market Dependency: Performance varies by market and timeframe. Backtesting is essential to ensure compatibility with your trading style.
Learning Curve: While presets simplify use, understanding regimes and indicators enhances effectiveness.
No Guaranteed Profits: Like all strategies, success depends on market conditions and proper execution. The Reddit discussion highlights skepticism about TradingView strategies’ universal success (Reddit Discussion).
Instrument Specificity: Optimized for futures (e.g., ES, NQ) due to fixed tick values. Test on other instruments like stocks or forex to verify compatibility.
📌Conclusion
The Dskyz (DAFE) AI Adaptive Regime - Pro is a revolutionary TradingView strategy that empowers everyday traders with advanced, AI-driven tools. Its ability to adapt to market regimes, confirm signals across timeframes, and manage risk dynamically. sets it apart from typical strategies. By offering beginner-friendly presets and visual cues, it makes sophisticated trading accessible without sacrificing power. Whether you’re a novice looking to trade smarter or a pro seeking a competitive edge, this strategy is your ticket to mastering the markets. Add it to your chart, backtest it, and join the elite traders leveraging AI to dominate. Trade like a boss today! 🚀
Use it with discipline. Use it with clarity. Trade smarter.
**I will continue to release incredible strategies and indicators until I turn this into a brand or until someone offers me a contract.
-Dskyz

Dragon Harmonic Pattern [TradingFinder] Dragon Detector🔵 Introduction
The Dragon Harmonic Pattern is one of the technical analysis tools that assists traders in identifying Potential Reversal Zones (PRZ). Resembling an "M" or "W" shape, this pattern is recognized in financial markets as a method for predicting bullish and bearish trends. By leveraging precise Fibonacci ratios and measuring price movements, traders can use this pattern to forecast market trends with high accuracy.
The Dragon Harmonic Pattern is built on the XABCD structure, where each point plays a significant role in shaping and forecasting price movements. Point X marks the beginning of the trend, representing the initial price movement. Point A indicates the first retracement, usually falling within the 0.380 to 0.620 range of the XA wave.
Next, point B signals the second retracement, which lies within 0.200 to 0.400 of the AB wave. Point C, acting as the hump of the pattern, is generally located within 0.800 to 1.100 of the XA wave. Finally, point D represents the endpoint of the pattern and the Potential Reversal Zone (PRZ), where the primary price reversal occurs.
In bullish scenarios, the Dragon Pattern indicates a reversal from a downtrend to an uptrend, where prices move upward from point D. Conversely, in bearish scenarios, prices decline after reaching point D. Accurate identification of this pattern through Fibonacci ratio analysis and PRZ examination can significantly increase the success rate of trades, enabling traders to adjust their strategies based on key market levels such as 0.618 or 1.100.
Due to its high accuracy in identifying Potential Reversal Zones (PRZ) and its alignment with Fibonacci ratios, the Dragon Harmonic Pattern is considered one of the most popular tools in technical analysis. Traders can use this pattern to pinpoint entry and exit points with greater confidence while minimizing trading risks.
Bullish :
Bearish :
🔵 How to Use
The Dragon Harmonic Pattern indicator helps traders identify bullish and bearish patterns in the market, allowing them to capitalize on available trading opportunities. By analyzing Fibonacci ratios and the XABCD structure, the indicator highlights Potential Reversal Zones (PRZ).
🟣 Bullish Dragon Pattern
In the Bullish Dragon Pattern, the price transitions from a downtrend to an uptrend after reaching point D. At this stage, points X, A, B, C, and D must be carefully identified.
Fibonacci ratios for these points are as follows: Point A should fall within 0.380 to 0.620 of the XA wave, point B within 0.200 to 0.400 of the AB wave, and point C within 0.800 to 1.100 of the XA wave.
When the price reaches point D, traders should look for bullish signals such as reversal candlesticks or increased trading volume to enter a buy position. The take-profit level can be set near the previous price high or based on the 1.272 Fibonacci ratio of the XA wave, while the stop-loss should be placed slightly below point D.
🟣 Bearish Dragon Pattern
In the Bearish Dragon Pattern, the price shifts from an uptrend to a downtrend after reaching point D. In this pattern, points X, A, B, C, and D must also be identified. Fibonacci ratios for these points are as follows: Point A should fall within 0.380 to 0.620 of the XA wave, point B within 0.200 to 0.400 of the AB wave, and point C within 0.800 to 1.100 of the XA wave.
Upon reaching point D, bearish signals such as reversal candlesticks or decreasing trading volume indicate the opportunity to enter a sell position. The take-profit level can be set near the previous price low or based on the 1.272 Fibonacci ratio of the XA wave, while the stop-loss should be placed slightly above point D.
By combining the Dragon Harmonic Pattern indicator with precise Fibonacci ratio analysis, traders can identify key opportunities while minimizing risks and improving their decision-making in both bullish and bearish market conditions.
🔵 Setting
🟣 Logical Setting
ZigZag Pivot Period : You can adjust the period so that the harmonic patterns are adjusted according to the pivot period you want. This factor is the most important parameter in pattern recognition.
Show Valid Forma t: If this parameter is on "On" mode, only patterns will be displayed that they have exact format and no noise can be seen in them. If "Off" is, the patterns displayed that maybe are noisy and do not exactly correspond to the original pattern.
Show Formation Last Pivot Confirm : if Turned on, you can see this ability of patterns when their last pivot is formed. If this feature is off, it will see the patterns as soon as they are formed. The advantage of this option being clear is less formation of fielded patterns, and it is accompanied by the latest pattern seeing and a sharp reduction in reward to risk.
Period of Formation Last Pivot : Using this parameter you can determine that the last pivot is based on Pivot period.
🟣 Genaral Setting
Show : Enter "On" to display the template and "Off" to not display the template.
Color : Enter the desired color to draw the pattern in this parameter.
LineWidth : You can enter the number 1 or numbers higher than one to adjust the thickness of the drawing lines. This number must be an integer and increases with increasing thickness.
LabelSize : You can adjust the size of the labels by using the "size.auto", "size.tiny", "size.smal", "size.normal", "size.large" or "size.huge" entries.
🟣 Alert Setting
Alert : On / Off
Message Frequency : This string parameter defines the announcement frequency. Choices include: "All" (activates the alert every time the function is called), "Once Per Bar" (activates the alert only on the first call within the bar), and "Once Per Bar Close" (the alert is activated only by a call at the last script execution of the real-time bar upon closing). The default setting is "Once per Bar".
Show Alert Time by Time Zone : The date, hour, and minute you receive in alert messages can be based on any time zone you choose. For example, if you want New York time, you should enter "UTC-4". This input is set to the time zone "UTC" by default.
🔵 Conclusion
The Dragon Harmonic Pattern is an advanced and practical technical analysis tool that aids traders in accurately predicting bullish and bearish trends by identifying Potential Reversal Zones (PRZ) and utilizing Fibonacci ratios. Built on the XABCD structure, this pattern stands out for its flexibility and precision in identifying price movements, making it a valuable resource among technical analysts. One of its key advantages is its compatibility with other technical tools such as trendlines, support and resistance levels, and Fibonacci retracements.
By using the Dragon Harmonic Pattern indicator, traders can accurately determine entry and exit points for their trades. The indicator analyzes key Fibonacci ratios—0.380 to 0.620, 0.200 to 0.400, and 0.800 to 1.100—to identify critical levels such as price highs and lows, offering precise trading strategies. In bullish scenarios, traders can profit from rising prices, while in bearish scenarios, they can capitalize on price declines.
In conclusion, the Dragon Harmonic Pattern is a highly reliable tool for identifying trading opportunities with exceptional accuracy. However, for optimal results, it is recommended to combine this pattern with other analytical tools and thoroughly assess market conditions. By utilizing this indicator, traders can reduce their trading risks while achieving higher profitability and confidence in their trading strategies.

Nen Star Harmonic Pattern [TradingFinder] NenStar Reversal Auto🔵 Introduction
The Nen-Star Harmonic Pattern is an advanced reversal pattern in technical analysis, designed to identify market trend changes and predict key price reversal points. This pattern is defined by a combination of Fibonacci ratios and critical concepts such as Potential Reversal Zones (PRZ), market structure, and corrective waves.
The key points of this pattern include X, A, B, C, and D, and it appears in both bullish and bearish forms. In its bullish form, the pattern resembles the letter M, while in its bearish form, it takes the shape of W. The critical Fibonacci ratios for this pattern are 0.382 to 0.786 for the XA wave, 1.13 to 1.414 for the AB wave, and 1.272 to 2.618 for the BC wave.
The Nen-Star Harmonic Pattern is one of the most precise tools for identifying market reversals and executing reversal trades. Traders can use it to pinpoint optimal entry and exit points and benefit from high risk-to-reward ratios.
By emphasizing Fibonacci retracement levels, XABCD waves, the formation of bullish and bearish patterns, and precise trade entry points, this pattern has become a practical tool in advanced technical analysis.
Bullish Nen-Star Pattern :
Bearish Nen-Star Pattern :
🔵 How to Use
The Nen-Star Harmonic Pattern indicator allows traders to automatically identify the bullish and bearish structures of this pattern and locate optimal entry and exit points. By accurately analyzing Fibonacci ratios and determining points X, A, B, C, and D, the indicator highlights Potential Reversal Zones (PRZ) on the chart. Traders can rely on the generated signals to manage their trades with greater precision.
🟣 Bullish Nen-Star Pattern
The bullish Nen-Star pattern begins with a price increase from point X to point A, followed by a retracement to point B, which lies between 0.382 and 0.786 of the XA wave.
After this retracement, the price moves to point C, located between 1.13 and 1.414 of the AB wave. The final movement is a price decline to point D, which is between 1.272 and 2.618 of the BC wave and 1.13 to 1.272 of the XA wave.
Point D : Serves as the key Potential Reversal Zone (PRZ).
Entry : A buy trade is initiated at point D, signaling the end of the corrective movement and the beginning of a price increase.
Price Targets :
61.8% retracement of the CD wave
Point A
Point C
1.272 and 1.618 extensions of the CD wave if resistance at point C is broken
Stop Loss : Placed slightly below point D.
🟣 Bearish Nen-Star Pattern
The bearish Nen-Star pattern starts with a price decrease from point X to point A, followed by a retracement to point B, which lies between 0.382 and 0.786 of the XA wave.
After this retracement, the price moves to point C, located between 1.13 and 1.414 of the AB wave. The final movement is a price increase to point D, which is between 1.272 and 2.618 of the BC wave and 1.13 to 1.272 of the XA wave.
Point D : Serves as the key Potential Reversal Zone (PRZ).
Entry : A sell trade is initiated at point D, signaling the end of the corrective movement and the beginning of a price decline.
Price Targets :
61.8% retracement of the CD wave
Point A
Point C
1.272 and 1.618 extensions of the CD wave if support at point C is broken
Stop Loss : Placed slightly above point D.
🔵 Setting
🟣 Logical Setting
ZigZag Pivot Period : You can adjust the period so that the harmonic patterns are adjusted according to the pivot period you want. This factor is the most important parameter in pattern recognition.
Show Valid Forma t: If this parameter is on "On" mode, only patterns will be displayed that they have exact format and no noise can be seen in them. If "Off" is, the patterns displayed that maybe are noisy and do not exactly correspond to the original pattern.
Show Formation Last Pivot Confirm : if Turned on, you can see this ability of patterns when their last pivot is formed. If this feature is off, it will see the patterns as soon as they are formed. The advantage of this option being clear is less formation of fielded patterns, and it is accompanied by the latest pattern seeing and a sharp reduction in reward to risk.
Period of Formation Last Pivot : Using this parameter you can determine that the last pivot is based on Pivot period.
🟣 Genaral Setting
Show : Enter "On" to display the template and "Off" to not display the template.
Color : Enter the desired color to draw the pattern in this parameter.
LineWidth : You can enter the number 1 or numbers higher than one to adjust the thickness of the drawing lines. This number must be an integer and increases with increasing thickness.
LabelSize : You can adjust the size of the labels by using the "size.auto", "size.tiny", "size.smal", "size.normal", "size.large" or "size.huge" entries.
🟣 Alert Setting
Alert : On / Off
Message Frequency : This string parameter defines the announcement frequency. Choices include: "All" (activates the alert every time the function is called), "Once Per Bar" (activates the alert only on the first call within the bar), and "Once Per Bar Close" (the alert is activated only by a call at the last script execution of the real-time bar upon closing). The default setting is "Once per Bar".
Show Alert Time by Time Zone : The date, hour, and minute you receive in alert messages can be based on any time zone you choose. For example, if you want New York time, you should enter "UTC-4". This input is set to the time zone "UTC" by default.
🔵 Conclusion
The Nen-Star Harmonic Pattern is a highly effective analytical tool in global financial markets, playing a crucial role in identifying reversal points and market trend changes. By leveraging Fibonacci principles and price structure, this pattern enables precise analysis across various assets, including stocks, cryptocurrencies, forex, and commodities.
Traders operating in global markets can use this pattern to identify high risk-to-reward trading opportunities. Its clear entry and exit points, defined Potential Reversal Zones (PRZ), and accurate price targets make it an excellent tool for risk management and profitability enhancement.
In the global context, the Nen-Star pattern is widely used by professional analysts in both advanced and emerging markets due to its versatility in analyzing long-term and short-term charts. Beyond trend prediction, it enhances trading strategies and optimizes investment decisions.
Combining this pattern with complementary tools such as volume analysis, technical indicators, and macroeconomic conditions can provide traders with deeper market insights, helping them capitalize on global opportunities.

3 Drive Harmonic Pattern [TradingFinder] Three Drive Reversal🔵 Introduction
The Three Drive harmonic pattern closely resembles other price structures such as Wedge Pattern and Three Push Pattern, yet it stands out due to its precise use of Fibonacci ratios and symmetrical price movements.
This pattern comprises three consecutive and symmetrical price drives, each validated by key Fibonacci ratios (1.27 and 1.618), which help identify critical Potential Reversal Zones (PRZ).
Unlike the Wedge, which relies on converging trend lines and can indicate either continuation or reversal, and the Three Push, which lacks defined Fibonacci ratios and symmetry, the Three Drive pattern defines PRZ with greater accuracy, providing traders with high-probability trading opportunities.
This pattern appears in both bullish and bearish trends. After the completion of the third drive (Drive 3), it signals the market's readiness to reverse direction. The PRZ in this pattern serves as a crucial zone where price is highly likely to reverse, offering a strategic point for entering or exiting trades. Professional traders utilize the Three Drive pattern and PRZ as essential tools for analyzing and capitalizing on potential market reversals.
Bullish Pattern :
Bearish Pattern :
🔵 How to Use
The Three Drive harmonic pattern is an effective tool for identifying potential reversal points in the market. By utilizing Fibonacci extension levels (1.27 and 1.618) and focusing on the pattern’s symmetry, traders can pinpoint Potential Reversal Zones (PRZ) where the price is likely to change direction. This pattern works in both bearish and bullish scenarios, each with distinct characteristics and trading opportunities.
🟣 Bullish Three Drive Pattern
The bullish Three Drive pattern develops during a downtrend, indicating a potential reversal to the upside. Similar to its bearish counterpart, this pattern features three consecutive downward price movements (drives) with retracements in between. The third drive concludes within the PRZ, which serves as a strong support zone where the price is expected to reverse upwards.
The first drive begins with a downward movement, followed by a retracement to the 0.618 Fibonacci level. The second drive continues downward to reach a 1.27 or 1.618 Fibonacci extension of the retracement. Finally, the third drive aligns with the PRZ, where a confluence of Fibonacci levels creates a high-probability support zone.
In the PRZ, traders look for bullish confirmation signals such as bullish candlestick patterns (e.g., bullish engulfing or pin bars) or increasing trading volume. Once confirmation is observed, the PRZ becomes an ideal entry point for a buy position. Stop-loss orders are placed slightly below the PRZ to minimize risk, while take-profit targets are set at key resistance levels or Fibonacci retracement levels.
🟣 Bearish Three Drive Pattern
The bearish Three Drive pattern forms during an uptrend, signaling a potential reversal to the downside. This pattern consists of three consecutive upward price movements (drives) and intermediate retracements. Each drive aligns with Fibonacci extension levels, and the third drive ends within the PRZ, indicating a high probability of a bearish reversal.
In the first drive, the price moves upward and then retraces to approximately the 0.618 Fibonacci retracement level, forming the base for the second drive. The second drive then extends upward to the 1.27 or 1.618 Fibonacci extension of the preceding retracement. This process repeats for the third drive, which reaches the PRZ, typically defined by the convergence of Fibonacci levels from previous drives.
Once the PRZ is identified, traders look for confirmation signals such as bearish candlestick patterns (e.g., bearish engulfing or pin bars) or declining trading volume. If confirmation is present, the PRZ becomes an optimal zone for entering a sell position. Stop-loss levels are typically placed slightly above the PRZ to protect against pattern failure, and take-profit targets are set at key support levels or Fibonacci retracement levels of the overall structure.
🟣 Three Drive Vs Wedge Pattern Vs 3 Push pattern
The Three Drive, Wedge, and Three Push patterns are all used to identify potential price reversal points, but they differ significantly in structure and application. The Three Drive pattern is based on three consecutive and symmetrical price movements, validated by precise Fibonacci ratios (1.27 and 1.618), to define Potential Reversal Zones (PRZ).
In contrast, the Wedge pattern relies on converging trend lines and does not require Fibonacci ratios; it can act as either a reversal or continuation pattern. Meanwhile, the Three Push pattern shares similarities with Three Drive but lacks precise symmetry and Fibonacci-based validation.
Instead of a PRZ, Three Push focuses on identifying areas of support and resistance, often signaling weakening momentum in the current trend. Among these, the Three Drive pattern is more reliable for pinpointing high-probability reversal zones due to its strict Fibonacci-based and symmetrical structure.
🔵 Setting
🟣 Logical Setting
ZigZag Pivot Period : You can adjust the period so that the harmonic patterns are adjusted according to the pivot period you want. This factor is the most important parameter in pattern recognition.
Show Valid Format : If this parameter is on "On" mode, only patterns will be displayed that they have exact format and no noise can be seen in them. If "Off" is, the patterns displayed that maybe are noisy and do not exactly correspond to the original pattern.
Show Formation Last Pivot Confirm : if Turned on, you can see this ability of patterns when their last pivot is formed. If this feature is off, it will see the patterns as soon as they are formed. The advantage of this option being clear is less formation of fielded patterns, and it is accompanied by the latest pattern seeing and a sharp reduction in reward to risk.
Period of Formation Last Pivot : Using this parameter you can determine that the last pivot is based on Pivot period.
🟣 Genaral Setting
Show : Enter "On" to display the template and "Off" to not display the template.
Color : Enter the desired color to draw the pattern in this parameter.
LineWidth : You can enter the number 1 or numbers higher than one to adjust the thickness of the drawing lines. This number must be an integer and increases with increasing thickness.
LabelSize : You can adjust the size of the labels by using the "size.auto", "size.tiny", "size.smal", "size.normal", "size.large" or "size.huge" entries.
🟣 Alert Setting
Alert : On / Off
Message Frequency : This string parameter defines the announcement frequency. Choices include: "All" (activates the alert every time the function is called), "Once Per Bar" (activates the alert only on the first call within the bar), and "Once Per Bar Close" (the alert is activated only by a call at the last script execution of the real-time bar upon closing). The default setting is "Once per Bar".
Show Alert Time by Time Zone : The date, hour, and minute you receive in alert messages can be based on any time zone you choose. For example, if you want New York time, you should enter "UTC-4". This input is set to the time zone "UTC" by default.
🔵 Conclusion
The Three Drive pattern is a highly effective harmonic tool for identifying potential reversal points in the market. By leveraging its symmetrical structure and precise Fibonacci ratios (1.27 and 1.618), this pattern provides traders with clear entry and exit signals, enhancing the accuracy of their trades.
Whether in bullish or bearish scenarios, the identification of the Potential Reversal Zone (PRZ) serves as a critical aspect of this pattern, enabling traders to anticipate price movements with greater confidence.
Compared to similar patterns like Wedge and Three Push, the Three Drive pattern stands out for its stringent reliance on Fibonacci levels and symmetrical price movements, making it a more robust choice for forecasting reversals. However, as with any technical analysis tool, its effectiveness increases when combined with confirmation signals, such as candlestick patterns, volume analysis, and broader market context.
Mastering the Three Drive pattern requires practice and attention to detail, especially in accurately defining the PRZ and ensuring the pattern adheres to its criteria. Traders who consistently apply this pattern as part of a comprehensive trading strategy can capitalize on high-probability opportunities and improve their overall performance in the market.

ABCD Harmonic Pattern [TradingFinder] ABCD Pattern indicator🔵 Introduction
The ABCD harmonic pattern is a tool for identifying potential reversal zones (PRZ) by using Fibonacci ratios to pinpoint critical price reversal points on price charts.
This pattern consists of four key points, labeled A, B, C, and D. In this structure, the AB and CD waves move in the same direction, while the BC wave acts as a corrective wave in the opposite direction.
The ABCD pattern follows specific Fibonacci ratios that enhance its accuracy in identifying PRZ. Typically, point C lies within the 0.382 to 0.886 Fibonacci retracement of the AB wave, indicating the correction extent of the BC wave.
Subsequently, the CD wave, as the final wave in this pattern, reaches point D with a Fibonacci extension between 1.13 and 2.618 of the BC wave. Point D, which marks the PRZ, is where a potential price reversal is likely to occur.
The ABCD pattern appears in both bullish and bearish forms. In the bullish ABCD pattern, prices tend to increase at point D, which defines the PRZ; in the bearish ABCD pattern, prices typically decrease upon reaching the PRZ at point D.
These characteristics make the ABCD pattern a popular tool for identifying PRZ and price reversal points in financial markets, including forex, cryptocurrencies, and stocks.
Bullish Pattern :
Beaish Pattern :
🔵 How to Use
🟣 Bullish ABCD Pattern
The bullish ABCD pattern is another harmonic structure used to identify a potential reversal zone (PRZ) where the price is likely to rise after a downward movement. This pattern includes four main points A, B, C, and D. In the bullish ABCD, the AB and CD waves move downward, and the BC wave acts as a corrective, upward wave. This setup creates a PRZ at point D, where the price may reverse and move upward.
To identify a bullish ABCD pattern, begin with the downward AB wave. The BC wave retraces upward between 0.382 and 0.886 of the AB wave, indicating the extent of the correction.
After the BC retracement, the CD wave forms and extends from point C down to point D, with an extension of around 1.13 to 2.618 of the BC wave. Point D, as the PRZ, represents the area where the price may reverse upwards, making it a strategic level for potential buy positions.
When the price reaches point D in the bullish ABCD pattern, traders look for upward reversal signals. This can include bullish candlestick formations, such as hammer or morning star patterns, near the PRZ to confirm the trend reversal. Entering a long position after confirmation near point D provides a calculated entry point.
Additionally, placing a stop loss slightly below point D helps protect against potential loss if the reversal does not occur. The ABCD pattern, with its precise Fibonacci structure and PRZ identification, gives traders a disciplined approach to spotting bullish reversals in markets, particularly in forex, cryptocurrency, and stock trading.
Bullish Pattern in COINBASE:BTCUSD :
🟣 Bearish ABCD Pattern
The bearish ABCD pattern is a harmonic structure that indicates a potential reversal zone (PRZ) where price may shift downward after an initial upward movement. This pattern consists of four main points A, B, C, and D. In a bearish ABCD, the AB and CD waves move upward, while the BC wave acts as a corrective wave in the opposite, downward direction. This reversal zone (PRZ) can be identified with specific Fibonacci ratios.
To identify a bearish ABCD pattern, start by observing the AB wave, which forms as an upward price movement. The BC wave, which follows, typically retraces between 0.382 to 0.886 of the AB wave. This retracement indicates how far the correction goes and sets the foundation for the next wave.
Finally, the CD wave extends from point C to reach point D with a Fibonacci extension of approximately 1.13 to 2.618 of the BC wave. Point D represents the PRZ where the potential reversal may occur, making it a critical area for traders to consider short positions.
Once point D in the bearish ABCD pattern is reached, traders can anticipate a downward price movement. At this potential reversal zone (PRZ), traders often wait for additional bearish signals or candlestick patterns, such as engulfing or evening star formations, to confirm the price reversal.
This confirmation around the PRZ enhances the accuracy of the entry point for a bearish position. Setting a stop loss slightly above point D can help manage risk if the price doesn’t reverse as anticipated. The ABCD pattern, with its reliance on Fibonacci ratios and clearly defined points, offers a strategic approach for traders looking to capitalize on potential bearish reversals in financial markets, including forex, stocks, and cryptocurrencies.
Bearish Pattern in OANDA:XAUUSD :
🔵 Setting
🟣 Logical Setting
ZigZag Pivot Period : You can adjust the period so that the harmonic patterns are adjusted according to the pivot period you want. This factor is the most important parameter in pattern recognition.
Show Valid Forma t: If this parameter is on "On" mode, only patterns will be displayed that they have exact format and no noise can be seen in them. If "Off" is, the patterns displayed that maybe are noisy and do not exactly correspond to the original pattern.
Show Formation Last Pivot Confirm : if Turned on, you can see this ability of patterns when their last pivot is formed. If this feature is off, it will see the patterns as soon as they are formed. The advantage of this option being clear is less formation of fielded patterns, and it is accompanied by the latest pattern seeing and a sharp reduction in reward to risk.
Period of Formation Last Pivot : Using this parameter you can determine that the last pivot is based on Pivot period.
🟣 Genaral Setting
Show : Enter "On" to display the template and "Off" to not display the template.
Color : Enter the desired color to draw the pattern in this parameter.
LineWidth : You can enter the number 1 or numbers higher than one to adjust the thickness of the drawing lines. This number must be an integer and increases with increasing thickness.
LabelSize : You can adjust the size of the labels by using the "size.auto", "size.tiny", "size.smal", "size.normal", "size.large" or "size.huge" entries.
🟣 Alert Setting
Alert : On / Off
Message Frequency : This string parameter defines the announcement frequency. Choices include: "All" (activates the alert every time the function is called), "Once Per Bar" (activates the alert only on the first call within the bar), and "Once Per Bar Close" (the alert is activated only by a call at the last script execution of the real-time bar upon closing). The default setting is "Once per Bar".
Show Alert Time by Time Zone : The date, hour, and minute you receive in alert messages can be based on any time zone you choose. For example, if you want New York time, you should enter "UTC-4". This input is set to the time zone "UTC" by default.
🟣 Conclusion
The ABCD harmonic pattern offers a structured approach in technical analysis, helping traders accurately identify potential reversal zones (PRZ) where price movements may shift direction. By leveraging the relationships between points A, B, C, and D, alongside specific Fibonacci ratios, traders can better anticipate points of market reversal and make more informed decisions.
Both the bearish and bullish ABCD patterns enable traders to pinpoint ideal entry points that align with anticipated market shifts. In a bearish ABCD, point D within the PRZ often signals a downward trend reversal, while in a bullish ABCD, this same point typically suggests an upward reversal. The adaptability of the ABCD pattern across different markets, such as forex, stocks, and cryptocurrencies, further highlights its utility and reliability.
Integrating the ABCD pattern into a trading strategy provides a methodical and calculated approach to entry and exit decisions. With accurate application of Fibonacci ratios and confirmation of the PRZ, traders can enhance their trading precision, reduce risks, and boost overall performance. The ABCD harmonic pattern remains a valuable resource for traders aiming to leverage structured patterns for consistent results in their technical analysis.
